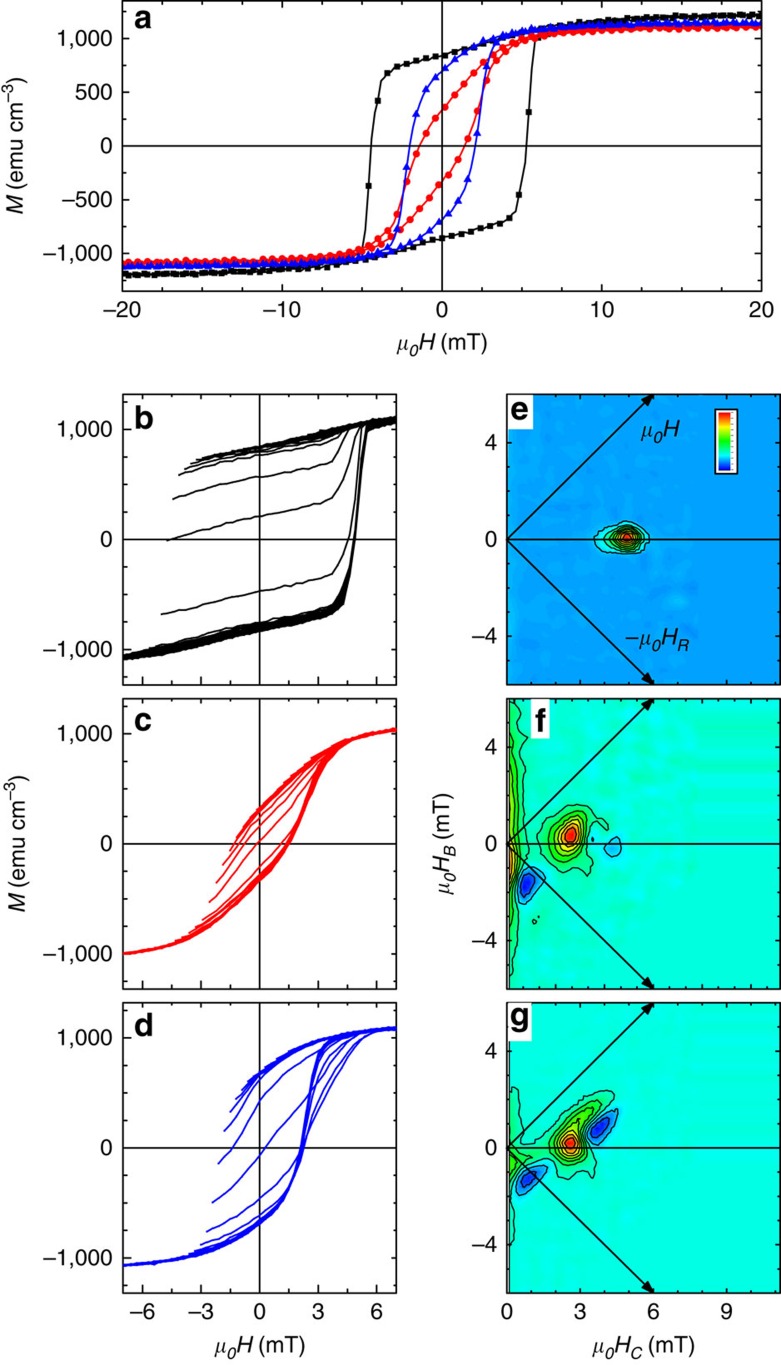
Figure 3. Magnetometry and FORC investigations.
(a) Combined major hysteresis loops for the sample (black) as-grown, (red) after +/−40 V conditioning and (blue) after thermal-only conditioning. Family of FORCs and FORC distributions for the sample (b,e) as-grown, (c,f) after +/−40 V conditioning and (d,g) after thermal-only conditioning. Color bar in e identifies the max (red) and min (blue) value of the FORC distribution.

