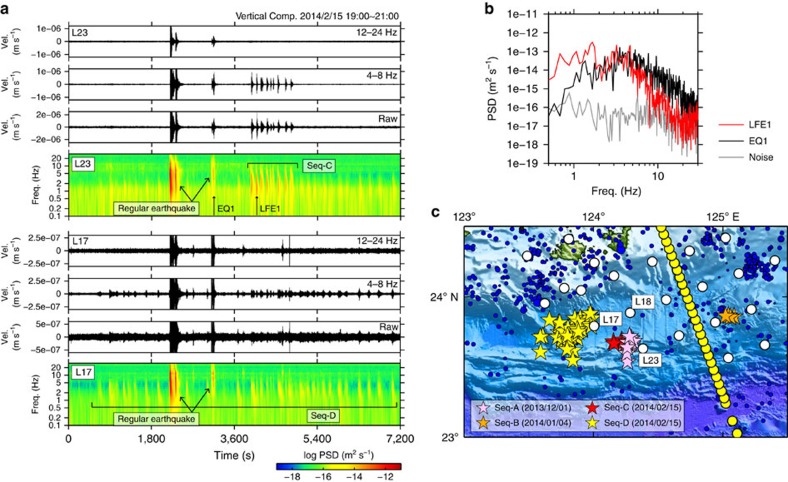
Figure 2. Seismic records and distribution of low-frequency earthquakes.
(a) Bandpass-filtered and raw seismograms and spectrograms of velocity waveforms for sequence C at ocean bottom seismograph (OBS) L17 and for sequence D at OBS L23. Note that the LFEs are enriched in low-frequency (4–8 Hz) energy and depleted in high-frequency (12–24 Hz) energy although regular earthquakes show clear signals in the both frequency bands. (b) Comparison of power spectral density (PSD) of the selected low-frequency earthquake (LFE), regular earthquake and background noise. (c) Epicentres of LFEs (stars) and regular earthquakes (blue dots). Colours of the stars correspond to different sequences of LFEs (A–D). Yellow and white circles indicate the positions of OBSs for active and passive sources, respectively. Note that hypocenter locations of sequence C were accurately determined by manually picked arrival times, while only the epicentral locations were constrained by the envelope correlation method27 for sequence A, B and D.

