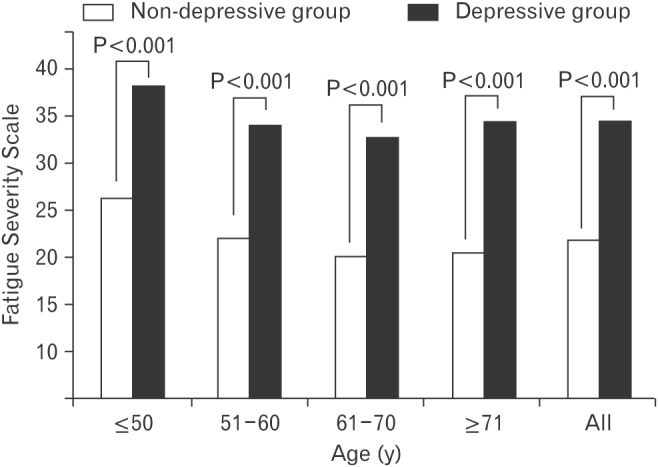
Figure 2. Comparisons of Fatigue Severity Scale score between non-depressive and depressive group. Depression was defined by PHQ-2. The depressive group had a PHQ-2 score of 1 or 2, and the non-depressive group had a PHQ-2 score of 0. Fatigue Severity Scale ranges between 9 (no fatigue) and 63 (most fatigue). The P-value for the differences between non-depressive and depressive groups was obtained by t-test. PHQ, Patient Health Questionnaire.

