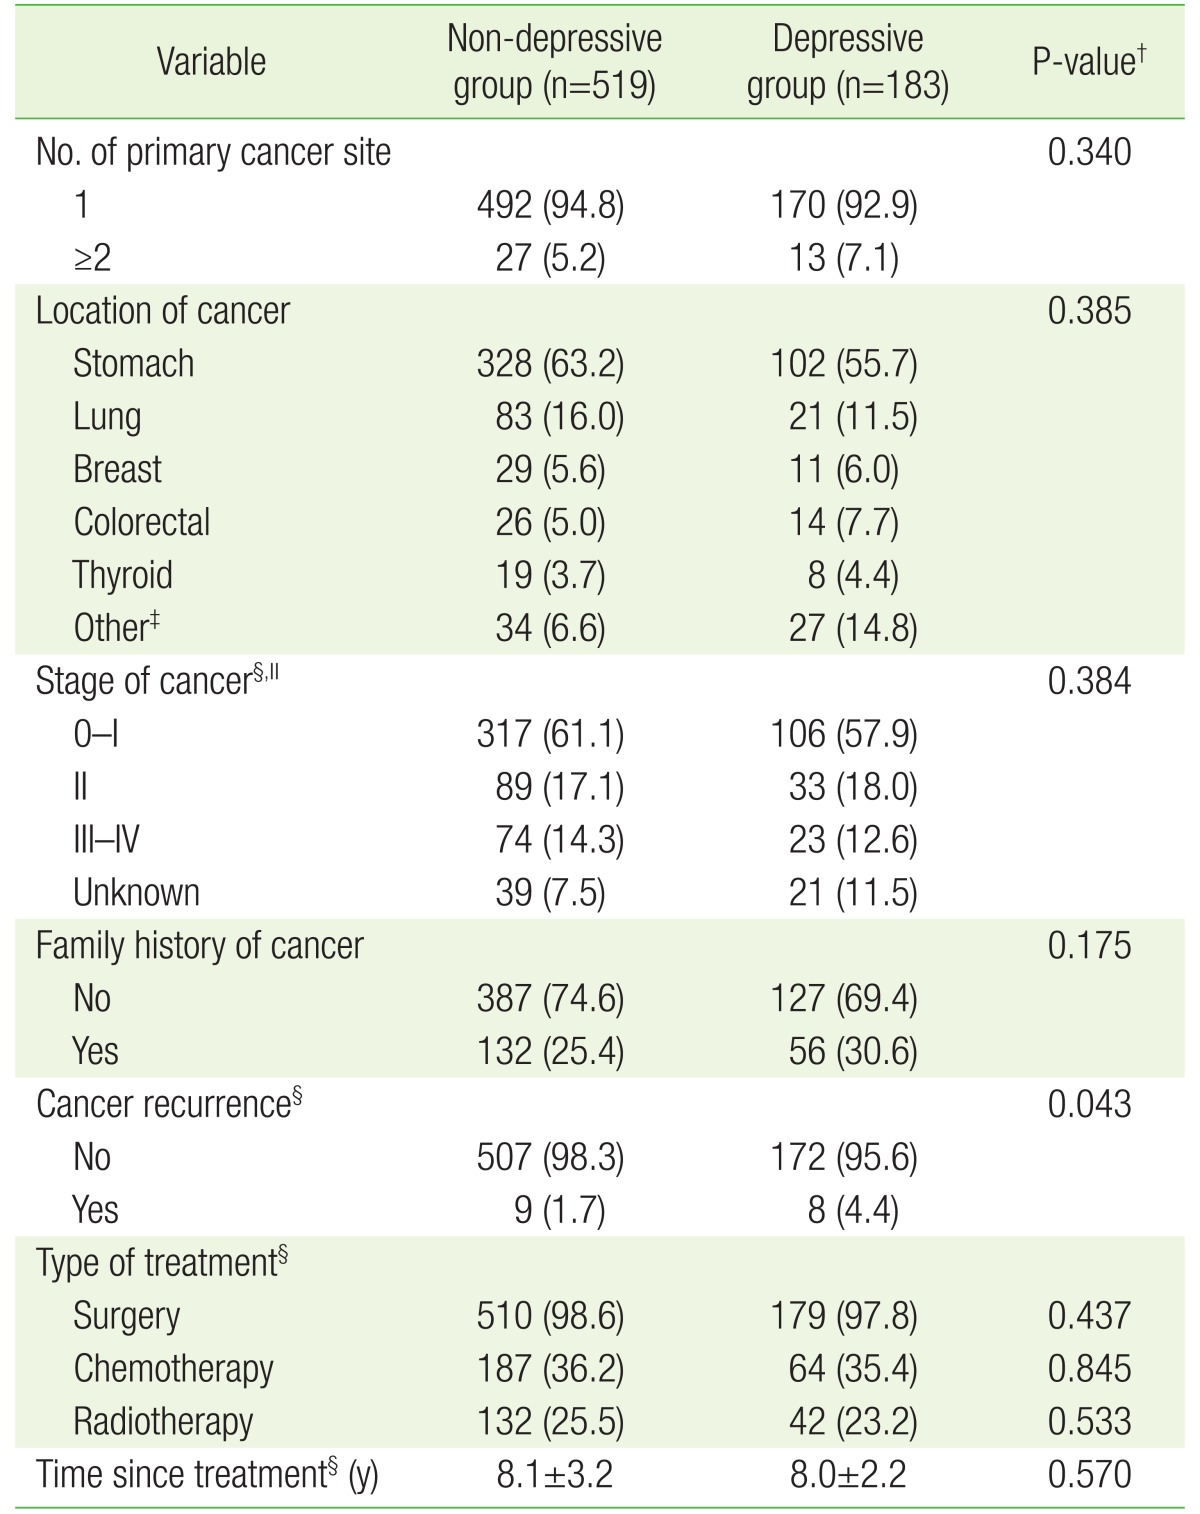
Table 2. Distribution of cancer-related clinical characteristics by the presence of depressiveness*.
Values are presented as mean±standard deviation or number (%).
PHQ, Patient Health Questionnaire.
*Defined by PHQ-2. The depressive group had a PHQ-2 score of 1 or 2, and the non-depressive group had a PHQ-2 score of 0. †Obtained by t-test for continuous variables and chi-square test for categorical variables. ‡Other cancer includes esophageal (n=19), head and neck (n=9), hepatobiliary (n=9), genitourinary (n=10), gynecologic (n=5), lymphoma (n=5), soft tissue sarcoma (n=2), skin (n=1), and ophthalmic (n=1). Except these cases, chi-square test was performed. §For some participants, information was not available. ∥If a patient has cancer at two or more sites with different stages, the highest stage was selected.

