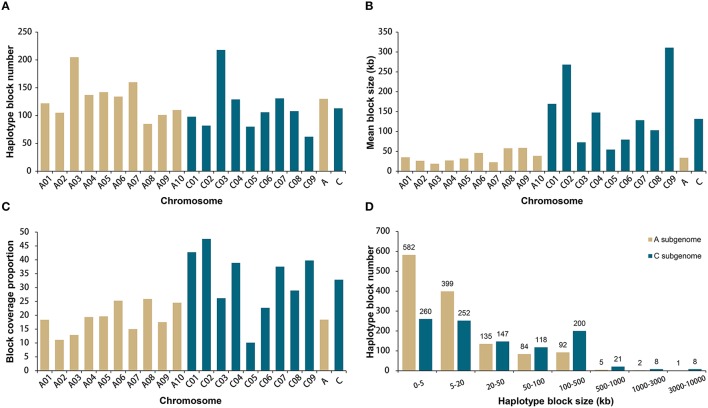
Figure 2.
Comparative analysis of haplotype blocks in the A and C subgenomes of 520 rapeseed accessions. (A) Haplotype block number on the A and C subgenome chromosomes. (B) Mean haplotype block size on the A and C subgenome chromosomes. (C) Haplotype block coverage proportion on the A and C subgenome chromosomes. (D) Size range distributions of the haplotype blocks in the A and C subgenomes.

