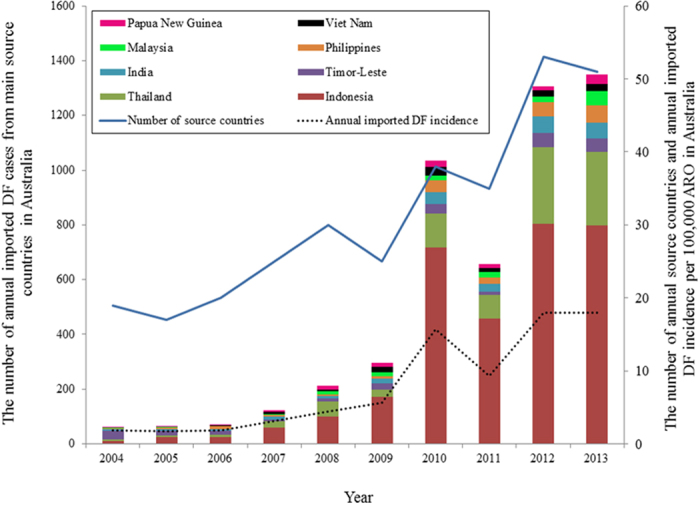
Figure 2. Number of source countries and imported DF incidence between 2004 and 2013 (Annual imported DF incidence per 100,000 ARO).

Blue line and dashed line showed the trends of the number of annual source countries of DF and annual imported DF incidence between 2004 and 2013, respectively. The bars showed the number of annual imported DF cases from main countries during 2004 to 2013.
