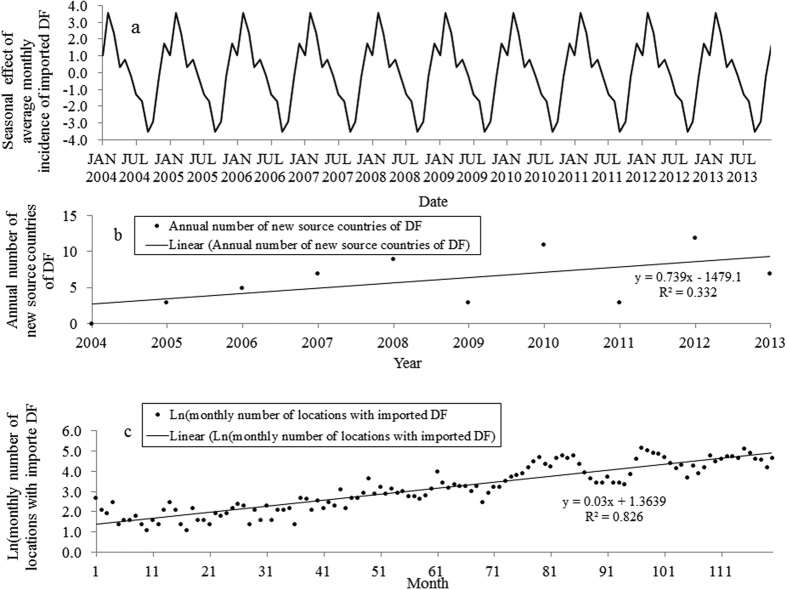
Figure 4.
(a) The pattern of the seasonal effect of imported DF over the study period in Australia. (b) Scatter plot with linear regression line for annual number of new countries of acquisition against time (year). (c) Scatter plot with linear regression line for the monthly number of the postal locations that received imported DF cases against time (month).

