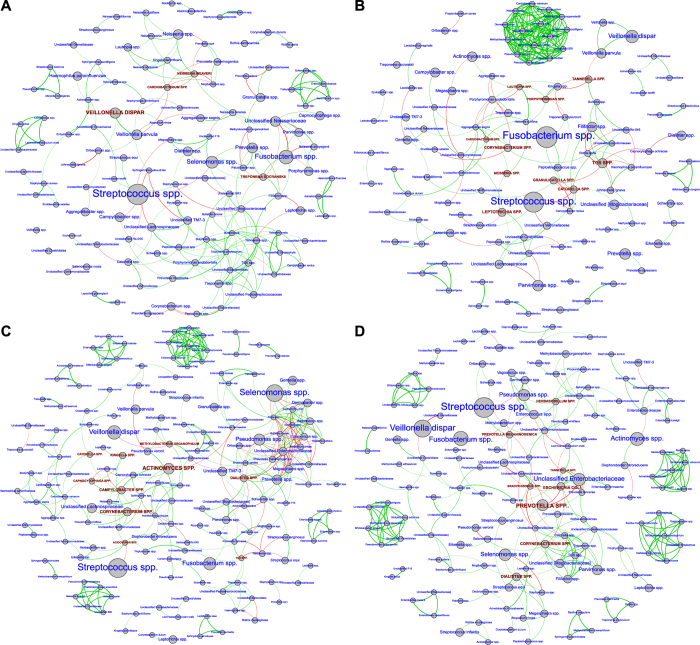
Figure 5. Co-occurrence networks in each group.
Non-pregnant, non-smoking control group are shown in Fig. 5A, smokers in 5B, pregnant women in 5C and pregnant smokers in 5D. Each network graph contains nodes (circles sized by relative abundance per group) and edges (lines). Nodes represent species-level OTU’s and edges represent Spearman’s ρ. Edges are colored green for positive correlation and red for negative correlation. Genera contributing to network robustness (anchoring OTUs) were computed as a function of genus degree. Only significant correlations (p < 0.05, t-test) with a coefficient of at least 0.75 are shown. Network anchors are highlighted in brown font and capital lettering.

