
Figure 2. The activity of the TH1 preparations.
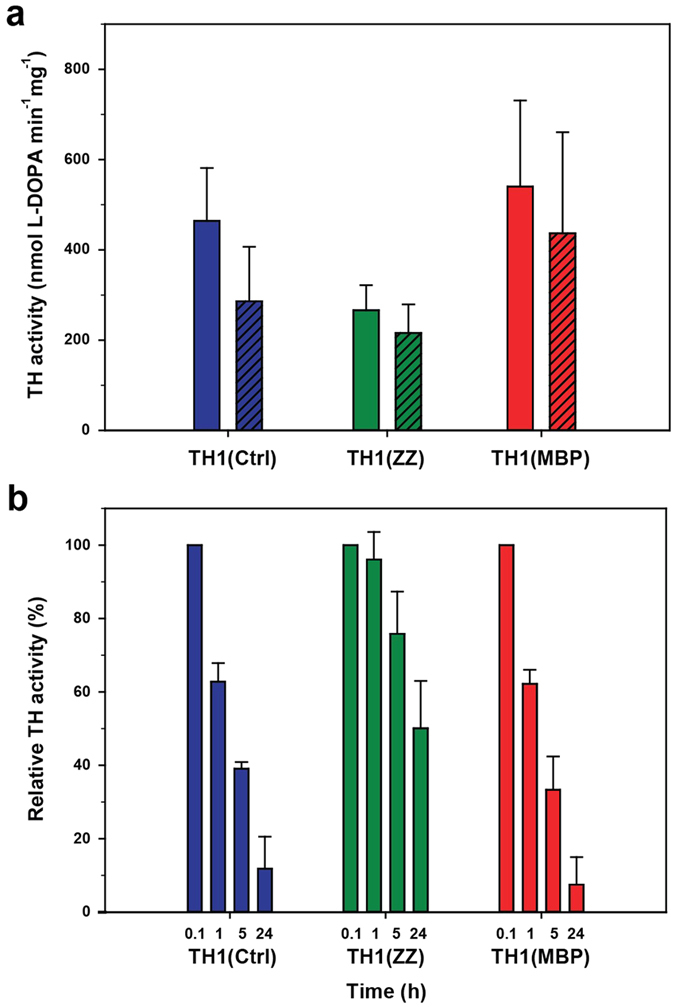
(a) Specific TH1 activity of TH1(Ctrl) (blue), TH1(ZZ) (green) and TH1(MBP) (red), with (closed bars) and without (hatched bars) addition of 10 μM Fe2+ in the assay. The data represent the mean ± combined SD of at least four independent measurements each performed in triplicates. (b) Remaining TH1 activity (% of initial activity) as a function of pre-incubation time. The activity of TH1(Ctrl) (blue), TH1(ZZ) (green), and TH1(MBP) (red) was measured with 50 μM L-Tyr and 200 μM BH4 after 5 min, 1 h, 5 h and 24 h pre-incubation at 37 °C, pH 7.0. The data represent the mean ± combined SD of two independent measurements where each data set was performed in triplicates and normalized to the initial activity (5 min pre-incubation).