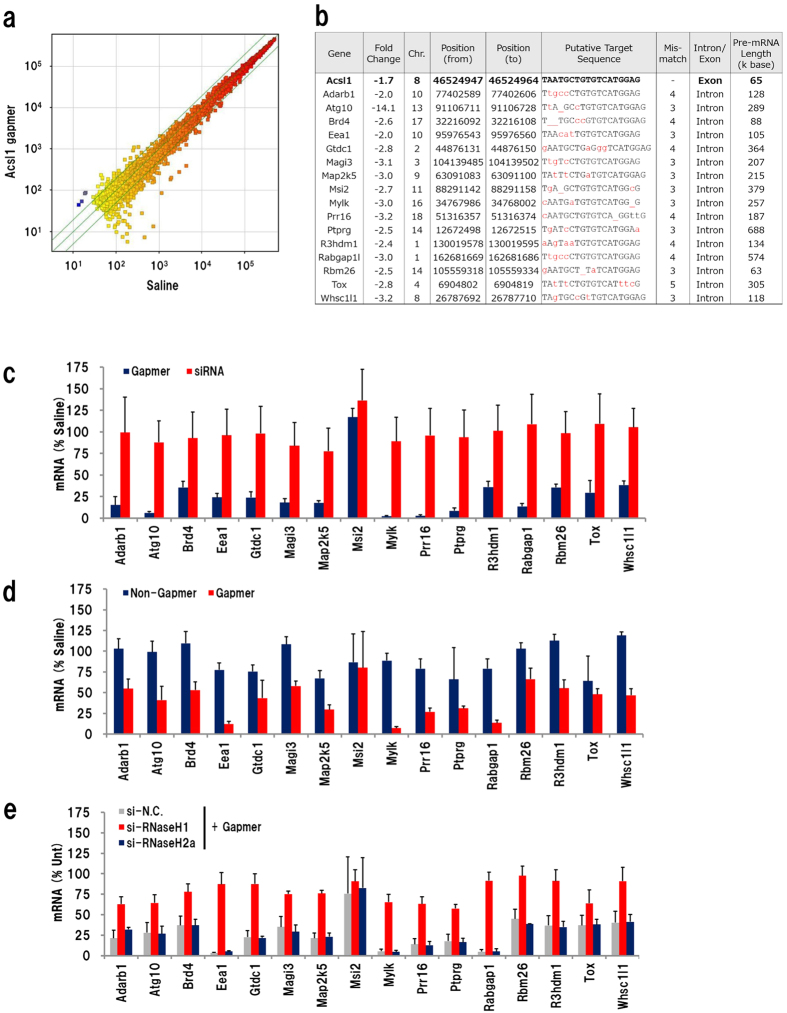
Figure 6. Analysis of off-target knockdown.
(a) Scatter plot of expression level data from Acsl1 gapmer- and saline-administrated mice liver. (b) Presumptive off-target protein-coding genes of the Acsl1 gapmer which showed greater than two-fold significant change. qRT-PCR analysis of the gene expression in liver of gapmer- or GalNAc3-siRNA-treated mice (c), non-gapmer- or gapmer-treated mice (d), and si-RNaseH + gapmer (e) (n = 3 or 4, mean + S.D.).

