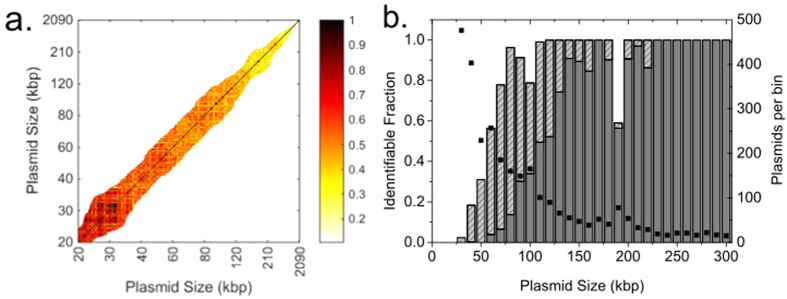
Figure 4. Comparing theoretical barcodes for all sequenced plasmids.
(a) Ĉ-values for all pairs of plasmids within 20% in size. (b) Identifiable fraction of plasmids of a certain size. The dashed bars are based on a separability-score (0.01) that is on the limit of possible detection. The dark grey bars correspond to an order of magnitude lower separability-score (0.001). The bin size is 10 kbp and the number of plasmids per bin is shown on the right hand vertical axis (full squares).

