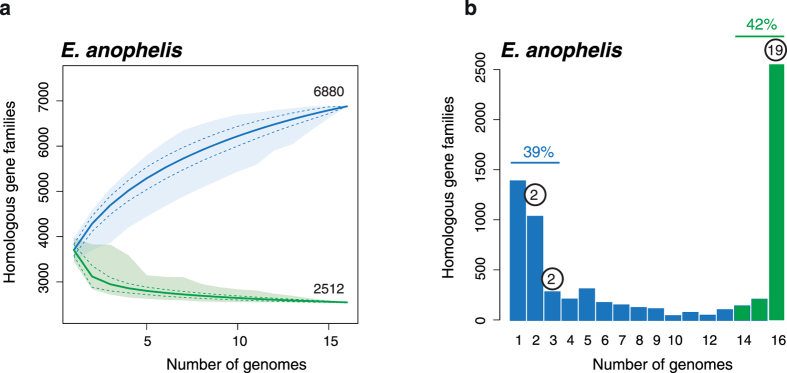
Figure 2.
Core- and pan-genome sizes of Elizabethkingia anophelis (a) and spectrum of frequencies for E. anophelis gene repertoires (b). The pan- and core-genomes were used to perform gene accumulation curves. These curves describe the number of new genes (pan-genome) and genes in common (core-genome) obtained by adding a new genome to a previous set. The procedure was repeated 1,000 times by randomly modifying the order of integration of genomes in the analysis. The spectrum of frequencies represents the number of genomes where the families of the pan-genome can be found, from 1 for strain-specific genes to 16 for core genes. Blue indicates accessory genes and green the genes that are highly persistent in E. anophelis. Numbers in circles above the bars indicate the number of antimicrobial resistance (AR) gene families.

