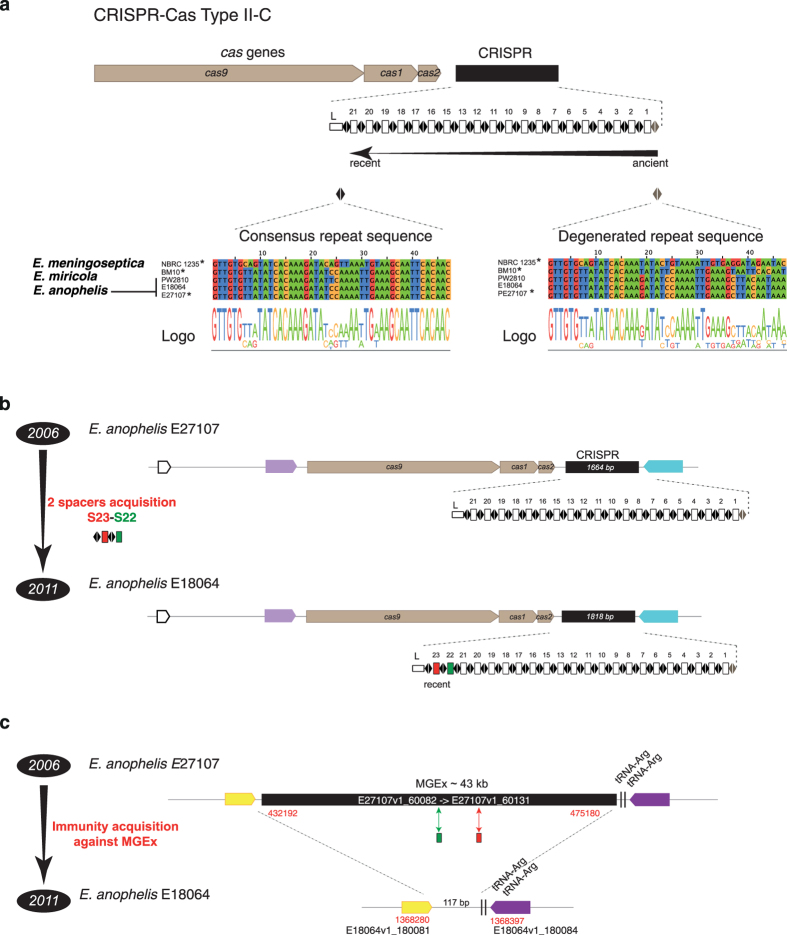
Figure 5. CRISPR-Cas type II-C organization and diversity.
(a) System organization is depicted on the top, with cas genes in brown, and the repeat-spacer array in black. Below the gene scheme, the repeat and spacer (captured MGEs) content is detailed as black diamonds and white rectangles, respectively. L corresponds to the leader sequence. Bottom line, consensus repeat sequence and degenerated repeat sequence in the 5 genomes containing such system. (b) Diversity of spacer content between the two Central African Republic hospital isolates. (c) Presence of a large MGE containing perfect matches with the two additional spacers S22 and S23.

