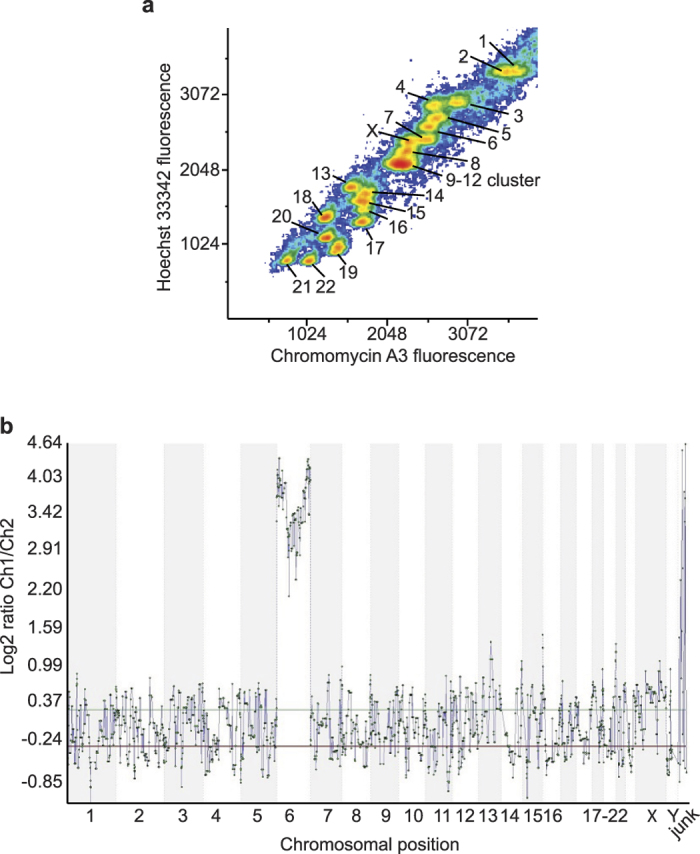
Figure 2. Separation of chromosomes and confirmation of isolated chromosome 6 samples.

(a) Bivariate flow plot of single chromosome acquisition sorting. The X-axis indicates the fluorescence emitted by Chromomycin A3 specific binding to guanine-cytosine (C-G) regions of DNA, the Y-axis indicates the fluorescence emitted by Hoechst 33258 binding to adenine-thymine (A-T) regions of DNA. (b) 24 Sure (+) BAC microarray (BlueGnome, Cambridge) of chromosome 6 signal hybridised against male reference genomic DNA indicating the presence of chromosomal DNA from chromosome 6. Background noise for the remaining chromosomes indicates a lack of DNA from chromosomes 1–5, 7–22, X or Y.
