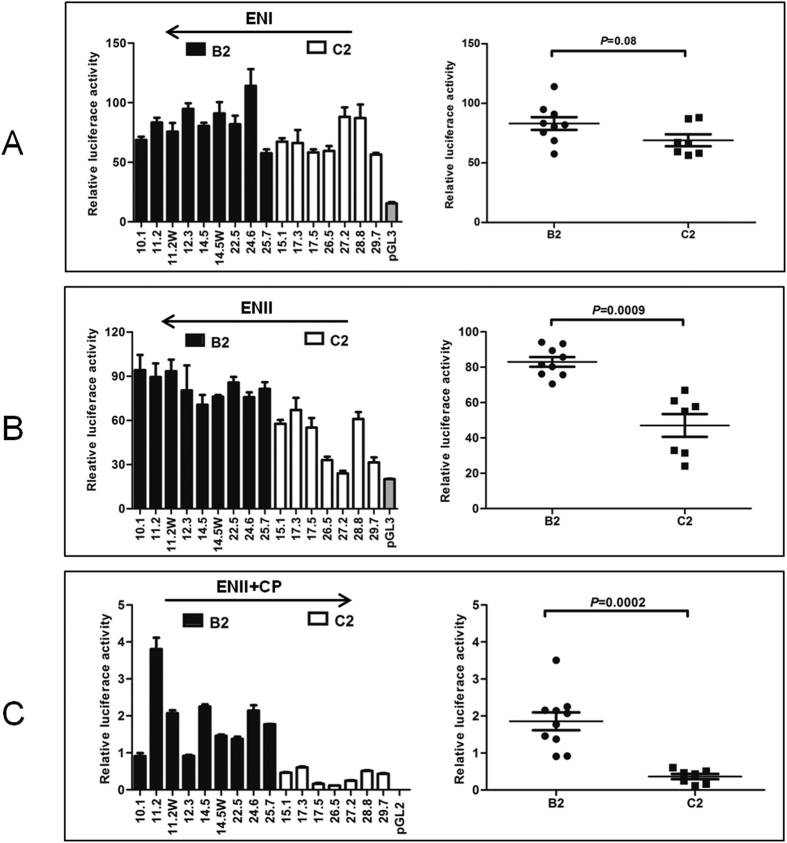
Figure 2.
Comparison of activities of ENI (A), ENII (B), and ENII+CP (C) between HBV isolates of the B2 and C2 subgenotypes. ENI (873–1276) or ENII (1592–1780) was amplified from nine B2 clones and seven C2 clones, and subcloned into pGL3 promoter vector in the antisense orientation. Alternatively, ENII+CP (1627–1866) was amplified from these clones and subcloned to pGL2 Basic Vector in the sense orientation. The constructs were transfected to Huh7 cells and luciferase activity was measured from cell lysate two days later. Shown are results from three independent experiments. The relative luciferase levels (firefly luciferase activity/renilla luciferase activity) for individual clones are shown as columns in the left panels, and as dots in the right panel, with the P values indicated.

