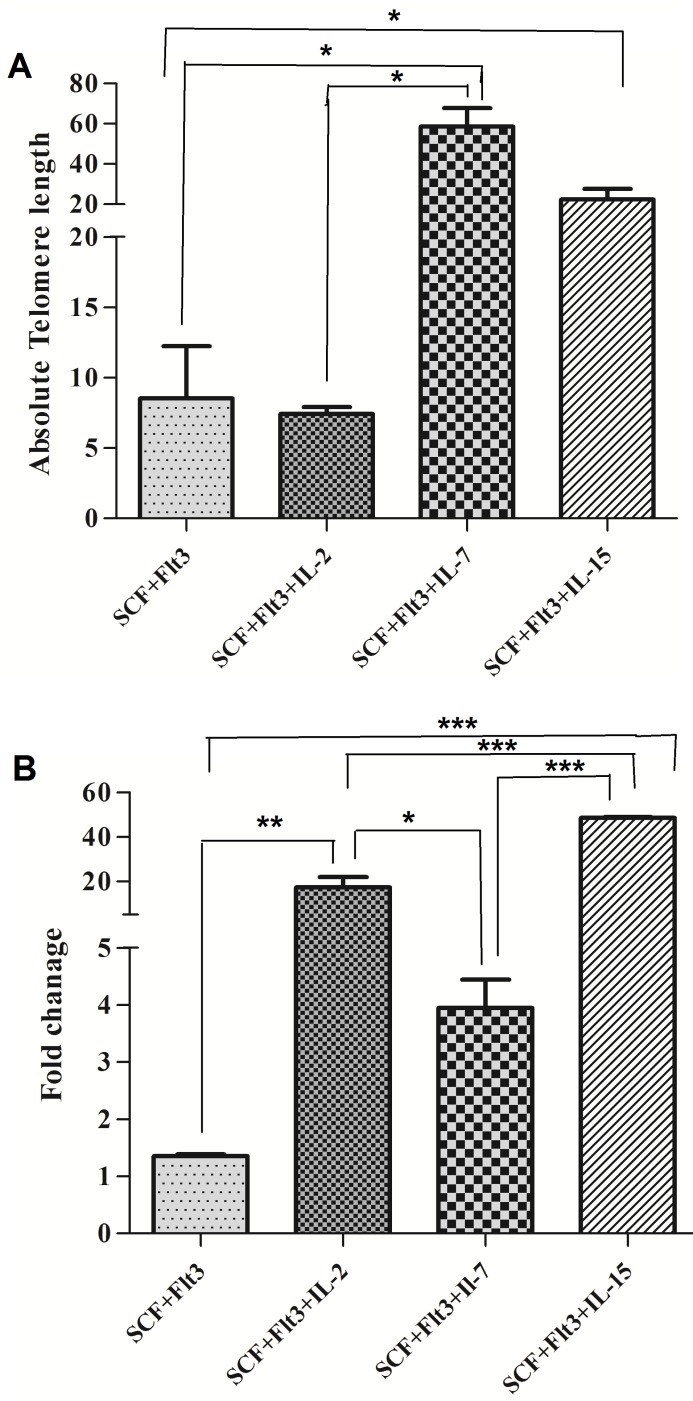
Figure 5.

Comparisons of telomere length and hTERT gene expression fold in different groups at 14th day of MNCs (using 80ng/µl of each cytokines). (A) telomere length (Kbp) in SCF+FLT3, SCF+FLT3+IL-2, SCF+FLT3+IL-7 and SCF+FLT3+IL-15 groups at 14th day of MNCs.(B) hTERT gene expression fold in SCF+FLT3, SCF+FLT3+IL-2, SCF+FLT3+IL-7 and SCF+FLT3+IL-15 groups at 14th day of MNCs. Differences between groups are significant at *p <0.05, **p <0.01, and ***p<0.001.
