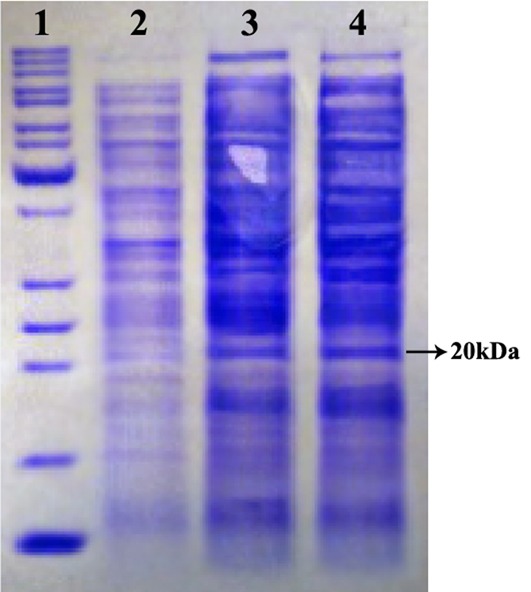
Figure 4.

Expression analysis of rhEs in periplasmic space using 12% SDS-PAGE under reduced condition. The band about 20 kDa represents the produced rhEs. Lane 1, protein marker is 10 to 200 kDa from down to up; lane 2, total protein before induction with IPTG as a control; lane 3 and 4, total protein after induction with IPTG in recombinant pET26b.
