Table 2.
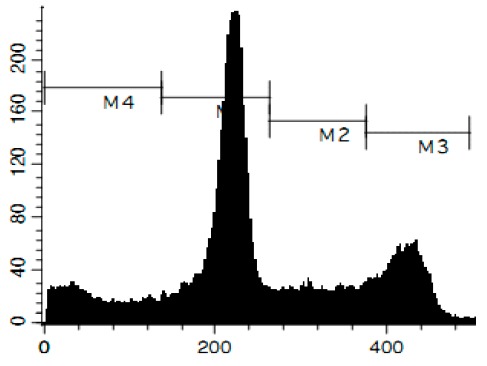
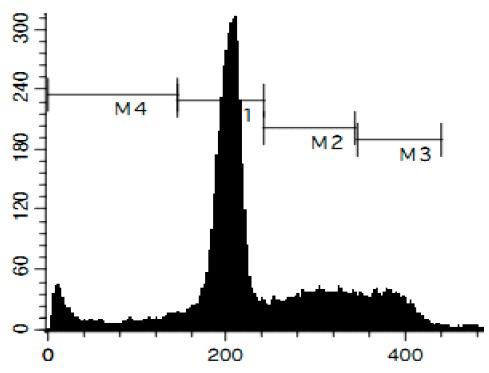
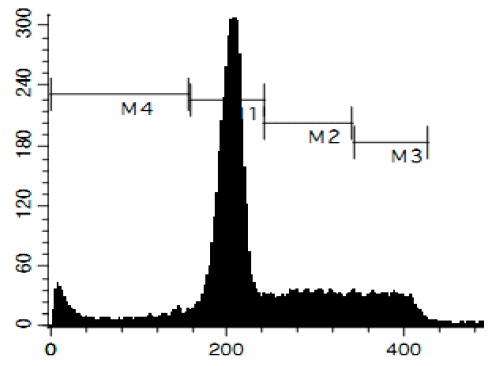
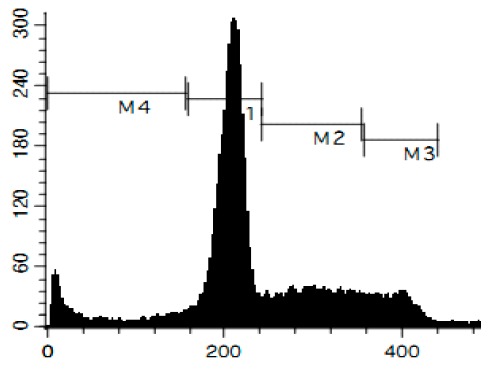
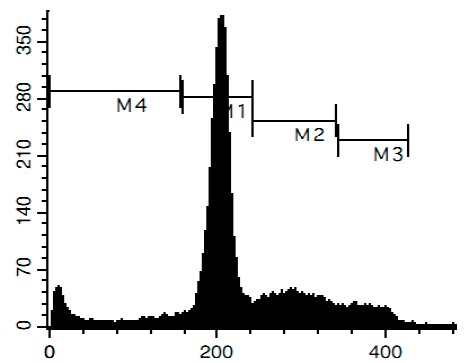
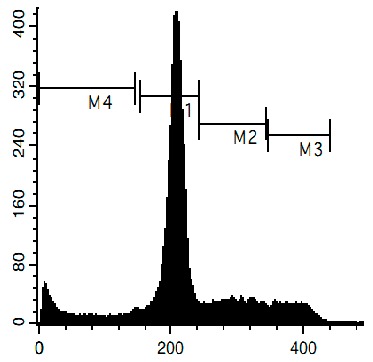
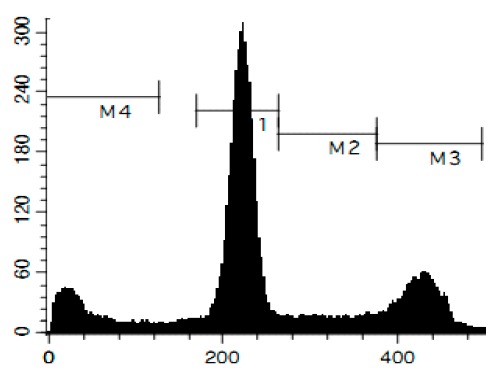
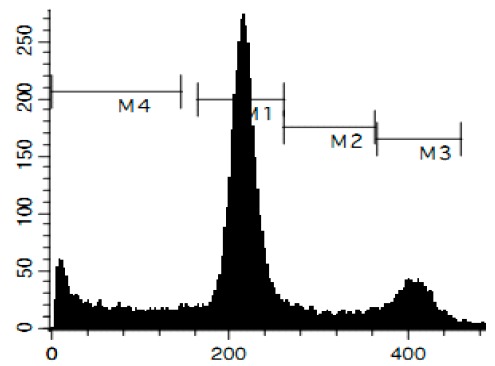
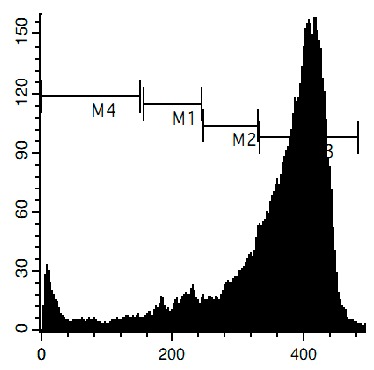
Cell cycle analysis of human cancer HeLa cells treated with alkaloids 1–8 at the concentrations of IC50 for 48 h.
| - | Control | 1 (Mc-A) | 2 (Mc-B) | 3 (Mm-C) | 4 (Pt-A) | 5 (Mm-B) | 6 (nMc-D) | 7 (Ur-A) | 8 (Pch-A) | Cis |
|---|---|---|---|---|---|---|---|---|---|---|
| G1-phase | 69.5 ± 1 | 62 ± 0.7 | 63.8 ± 1.5 | 65.6 ± 1.8 | 65.4 ± 0.4 | 66.3 ± 0.9 | 71.4 ± 0.1 | 65.3 ± 3 | 73 ± 1.5 | 7 ± 0.6 |
| S-phase | 13.8 ± 0.4 | 17 ± 0.7 * | 21 ± 0.1 * | 21.5 ± 1.4 * | 22.6 ± 2 * | 23.7 ± 1.2 * | 17.6 ± 0.2 * | 10.6 ± 0.8 | 11.2 ± 1.5 | 15.6 ± 3.5 |
| G2/M-phase | 16.3 ± 0.7 | 21.4 ± 1.3 * | 14.9 ± 0.8 | 12.1 ± 2.1 | 12.2 ± 1.5 | 10.3 ± 1.1 | 10.5 ± 0.8 | 23.7 ± 0.5 * | 15.7 ± 0.8 | 77.6 ± 3.7 * |
| Cell cycle arrest | S, G2/M | S | S | S | S | S | G2/M | no | G2/M | |
| Raw data | 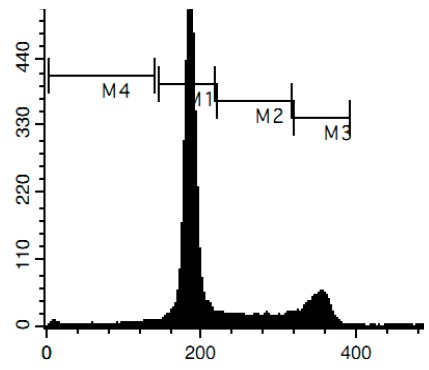 |
 |
 |
 |
 |
 |
 |
 |
 |
 |
* indicates values significantly different from control.
