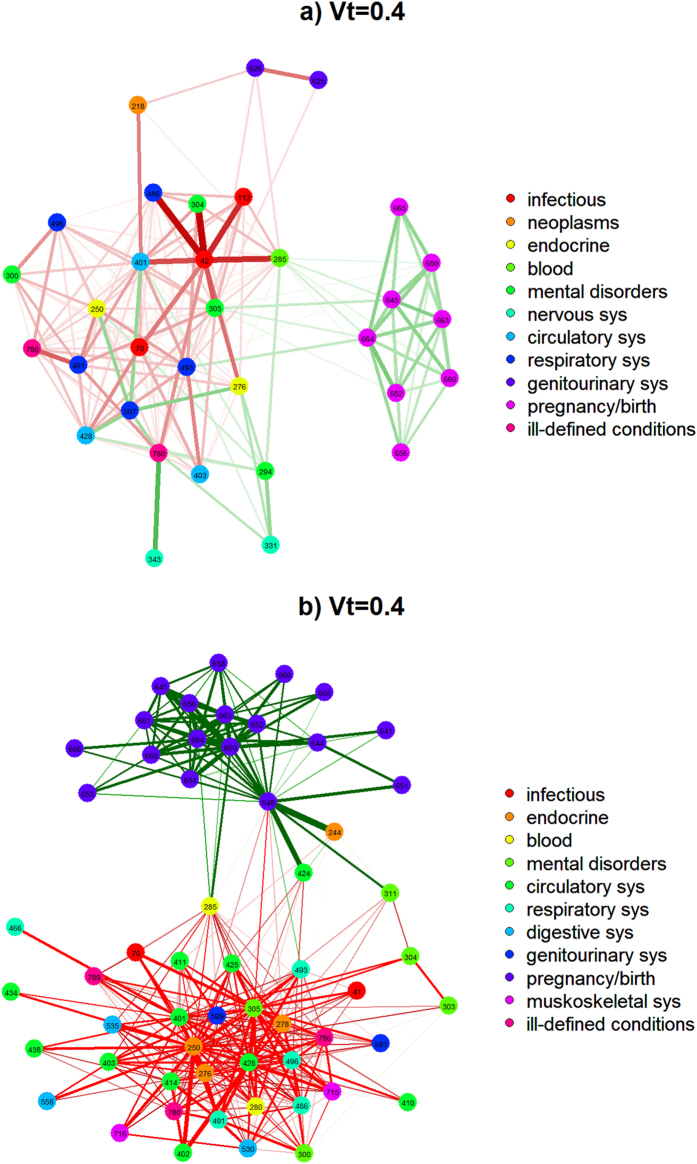
Figure 1. Presents a visualization detailing the diagnosis fold-change between the low and high income populations in a single network representation.
(a) Complete Network Visualization comparing low income and high income populations. (b) Network Visualization without pregnancy/birth related diagnoses.

