Figure 7.

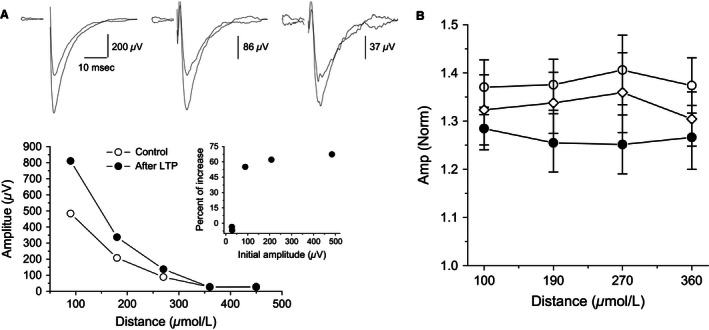
LTP amplitude is uniform throughout the cortical slice (A) Top: Recordings from three layer II adjacent electrodes before and after LTP induction, with amplitudes normalized to the fPSP closest to the stimulation before LTP induction. Bottom Values of measured fPSPs recorded from five layer II recording electrodes, before and after LTP induction. Inset: average LTP recorded from the five electrodes; LTP was similar in all location where it could be induced. Traces were recorded in a slice taken from a naïve rat. (B) Quantitative description of LTP as a function of distance from the stimulating electrode. For three groups, LTP was induced to the same value, regardless of the distance from the stimulating electrode. While LTP had a somewhat lesser averaged value in slices form trained rats, the differences between the three groups did not reach the level of significant difference. Open circles: naïve, filled circles: trained, open diamonds: pseudotrained. Values represent mean ± SE. Graphs describe data from the same recordings shown in Figure 6.
