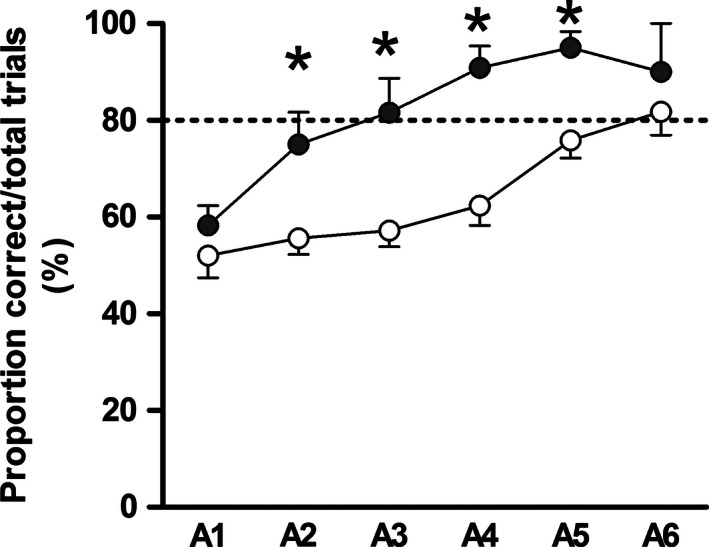
Figure 2.

T‐maze experiment. T‐maze test using term (black symbols, n = 6) and preterm (white symbols, n = 17) pigs. Each symbol represents average performance (mean ± SEM) of all pigs and of all ten trials for each of six consecutive days (A1–A6), starting on postnatal day 15. The term pigs reached the learning criterion (80% correct choices) 3 days before the preterm pigs (*P < 0.05).
