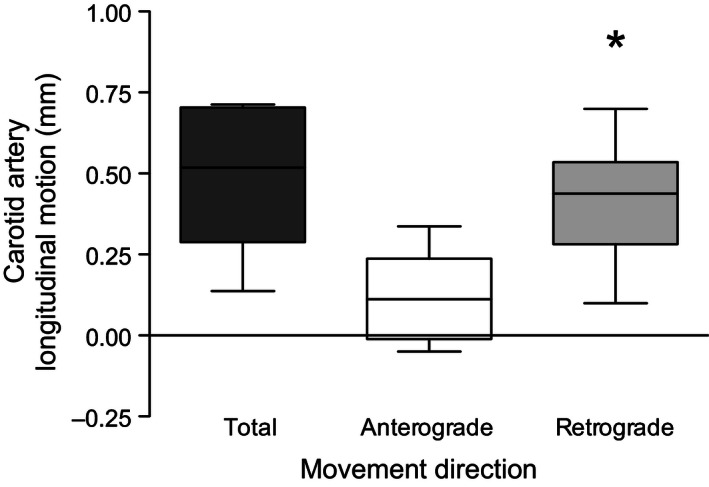
Figure 2.

Total excursion, absolute anterograde, and absolute retrograde carotid artery longitudinal motion of the intima‐media layer of the common carotid artery wall. The box represents the 25th, 50th (median), and 75th percentiles. The bars represent the minimum and maximum values. *P < 0.01 compared with anterograde motion.
