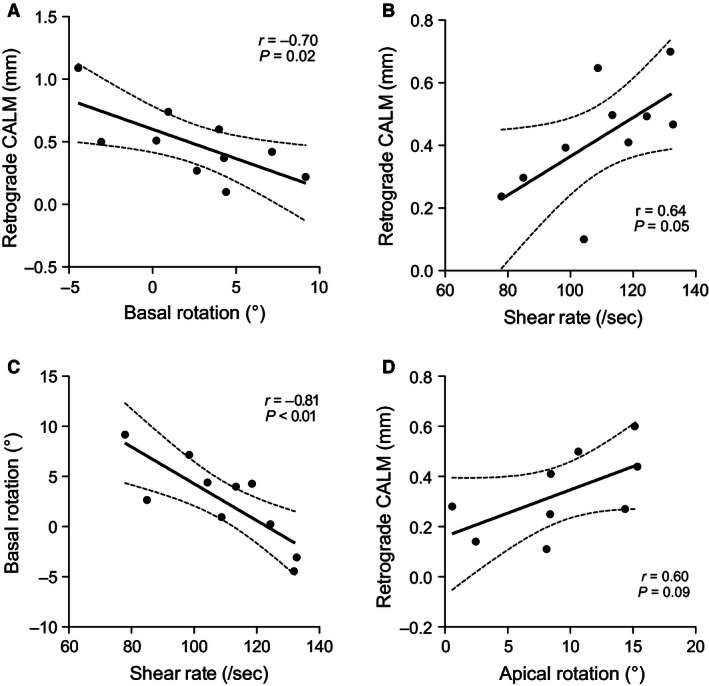
Figure 4.

Correlations among the magnitude of events plotted with the 95% confidence intervals. (A) Basal rotation and retrograde CALM. (B) Carotid shear rate and retrograde CALM. (C) Carotid shear rate and basal rotation. (D) Apical rotation and retrograde CALM. Retrograde CALM and basal rotation are expressed as positive values.
