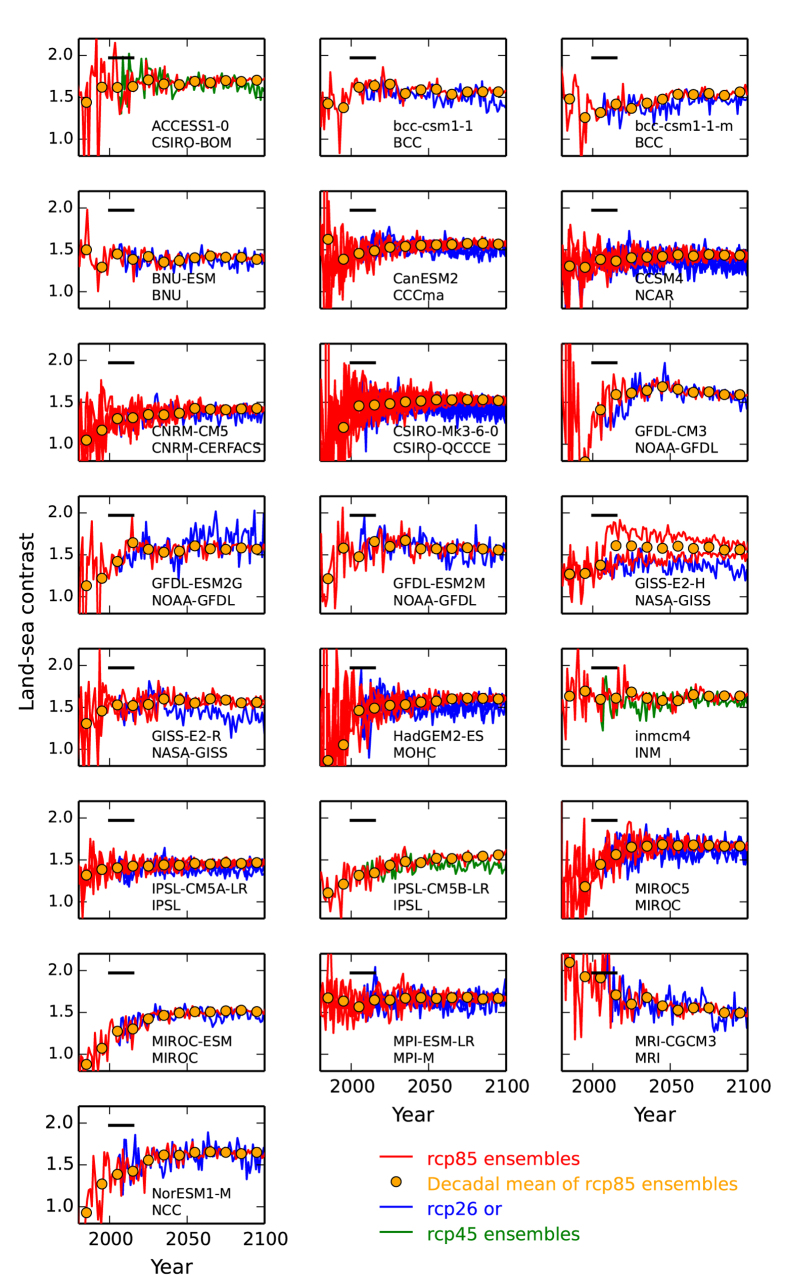
Figure 2. Land-sea warming contrast.
For each GCM and associated research centre named in panels, for period 1980–2100, shown are model estimates of ensemble- and decadal-mean land-ocean temperature contrast, v, as orange dots. These are for the rcp85 scenario. Yearly calculations of v for rcp85 are given as red curves for each available model ensemble member. Also shown are ensemble members for rcp26, as blue curves. Where rcp26 simulations are unavailable, then rcp45 is given instead and as green curves.

