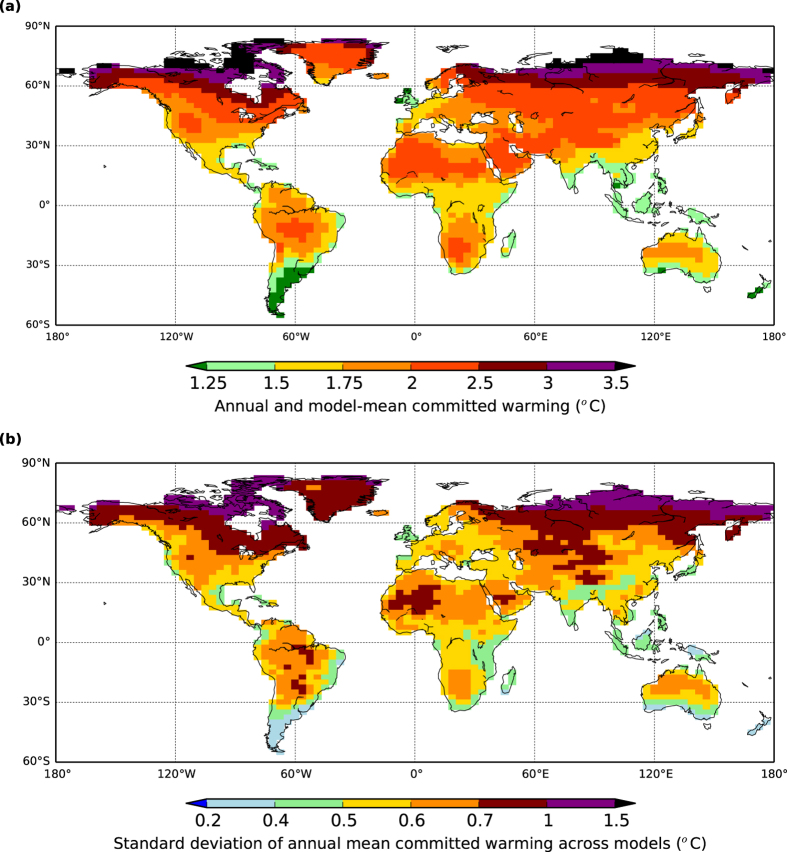
Figure 3. Annual mean GCM-based estimates of committed warming.
Maps of calculated equilibrium warming levels for contemporary year 2015 greenhouse gas concentrations, based on knowledge of individual GCM climate sensitivity, land-ocean contrast and regional pattern-scaling. Panel (a) is multi-model mean of annual warming and panel (b) is the standard deviation between the GCMs emulated by scaling. GCMs considered are the same as those listed in Fig. 1. Figure created with Basemap module of python software package Matplotlib, version 1.3.1 (http://matplotlib.org/1.3.1).

