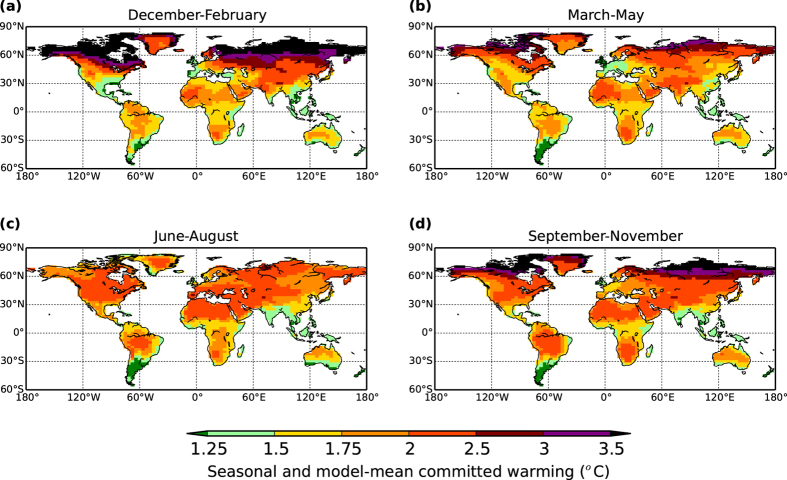
Figure 4. Seasonal mean GCM-based estimates of committed warming.
As for Fig. 3a, but presented instead as seasonal means averaged across the GCMs emulated. Panels (a–d) represent the seasons as given in the panel titles. Figure created with Basemap module of python software package Matplotlib, version 1.3.1 (http://matplotlib.org/1.3.1).

