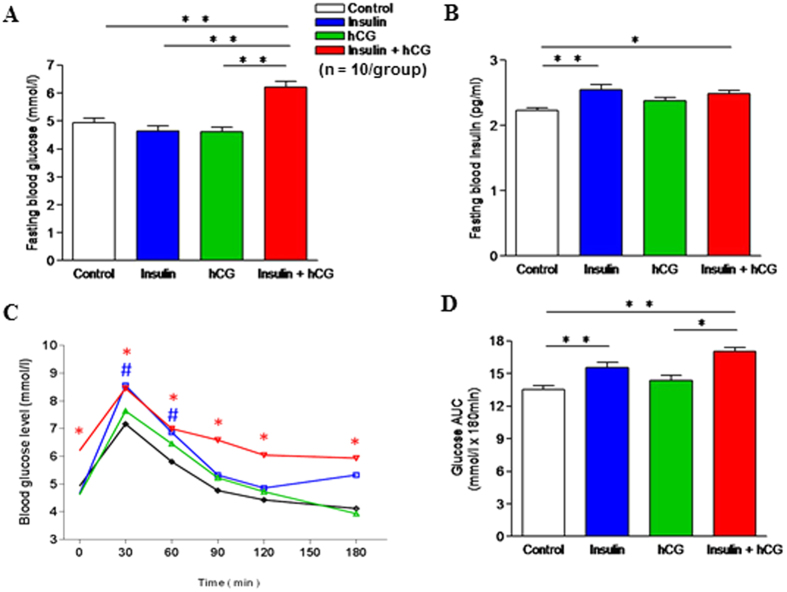
Figure 1. Effects of insulin and/or hCG on glucose tolerance in rats.
(A) Fasting blood glucose. **p < 0.01 versus the insulin+hCG group. (B) Fasting blood insulin. *p < 0.05; **p < 0.01 versus the control group. (C) Changes in blood glucose concentrations during OGTT in the control, insulin, hCG, and insulin+hCG groups. #p < 0.05 (the insulin group versus the control group), *p < 0.05 (the insulin+hCG group versus the control group), determined by analysis of variance (ANOVA) comparing control to different treatment. (D) Area under the curve (AUC) for glucose. AUC was calculated by the formula [0.5 × (BG0 + BG30)/2 + 0.5 × (BG30 + BG60)/2 + 0.5 × (BG60 + BG120)/2 + 0.5 × (BG120 + BG180)/2] where the BG terms are the blood glucose levels at 0 min, 30 min, etc. *p < 0.01 versus the hCG group; **p < 0.01 versus the control group. Values are expressed as means ± SEM.

