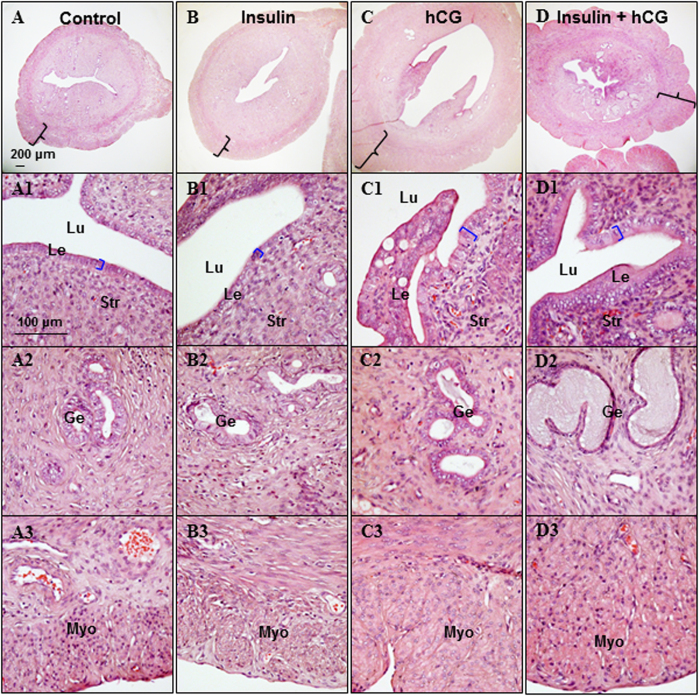
Figure 2. Structure of the insulin and/or hCG-treated uterus.
All representative photomicrographs are of cross sections of the uterine middle zone. Uterine tissue sections were stained with hematoxylin and eosin. The investigators were blinded to allocation for histological analyses (n = 10/group). Lu, lumen; Le, luminal epithelial cells; Ge, glandular epithelial cells; Str, stromal cells; Myo, myometrium. Scale bars are indicated in the photomicrographs.

