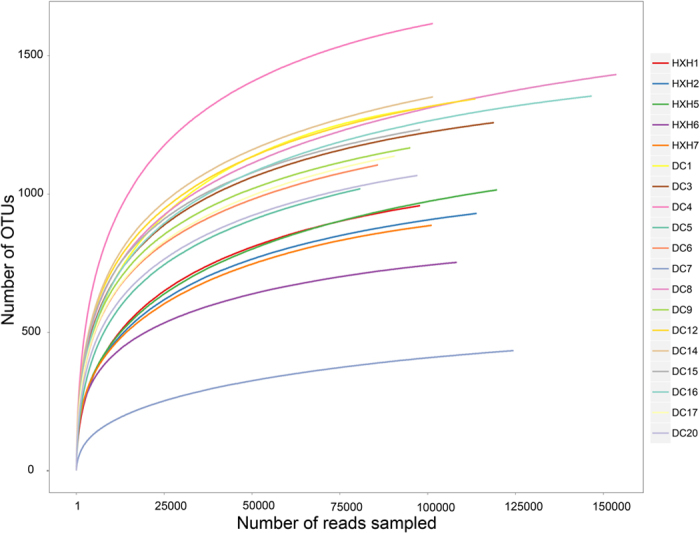
Figure 2. Rarefaction curves of OTUs for the bacterial communities’ samples from DC and HXH.

The rarefaction curves of determined tags tend to approach the saturation plateau.

The rarefaction curves of determined tags tend to approach the saturation plateau.