
Figure 2. Rarefaction curves of OTUs for the bacterial communities’ samples from DC and HXH.
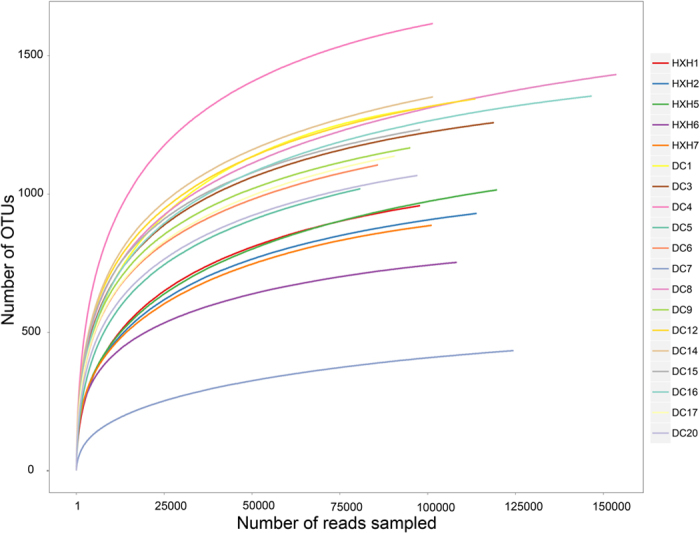
The rarefaction curves of determined tags tend to approach the saturation plateau.
Official websites use .gov
A
.gov website belongs to an official
government organization in the United States.
Secure .gov websites use HTTPS
A lock (
) or https:// means you've safely
connected to the .gov website. Share sensitive
information only on official, secure websites.
The rarefaction curves of determined tags tend to approach the saturation plateau.