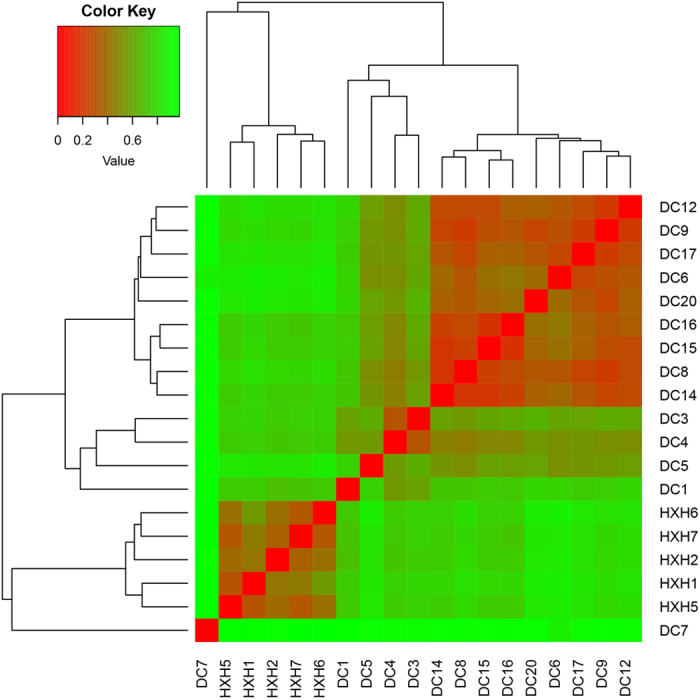
Figure 4. Heatmap representing the differences among samples based on Bray-Crutis distance measures.

Bray-Curtis distances were calculated based on the formula:  . Computes the distance between μ and ν sample. i represents the OTU i in each sample. Based on the Bray-Crutis distance, a matrix was created among all samples and then for heatmap analysis.
