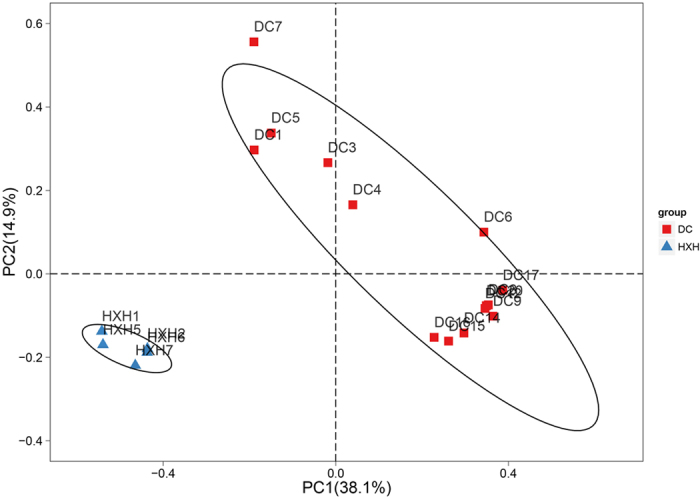
Figure 5. PCoA of the dissimilarities among bacterial community taxonomical structures using thetaYC distances.

ThetaYC ( ) measures the dissimilarity between the structures of two communities, where ST is the total number of OTUs in communities μ and ν, μi and νi is the relative abundance of OTU i in community μ and ν, respectively. A matrix of pairwise thetaYC-based distances among all samples was calculated for PCoA analysis.
