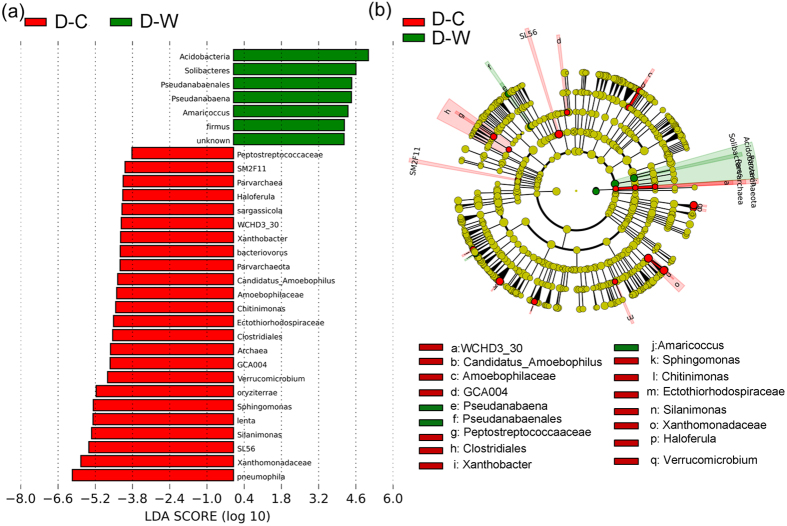
Figure 7. Comparison between bacterial community samples from D-W and D-C by indicator and cladogram.
Samples divided into two groups according to the logarithmic LDA score, which were all higher than 3.8. (a) Sorted by degree of difference and (b) overlaid on a complete cladogram. Cladogram showed the bacterial distribution of two types of freshwater, and differences in abundance between them were presented as colors and circle’s diameters.

