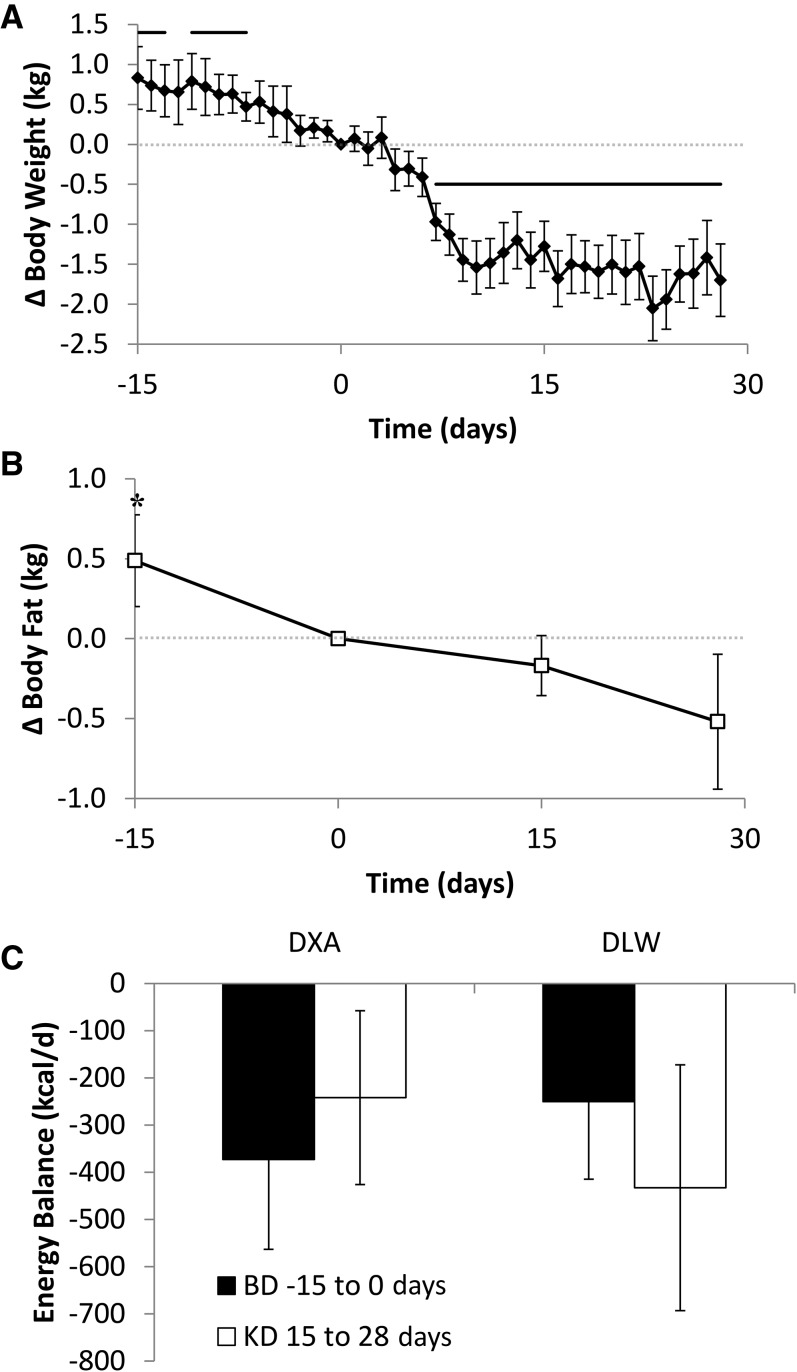
FIGURE 2.
Body composition and overall energy balance. Subjects experienced an unintentional loss of (A) body weight (◆) and (B) fat mass (□) throughout the study, indicating an overall state of negative energy balance. Weight loss was accelerated during the first 2 wk of the KD, but the rate of body fat loss slowed during this period. During the final 2 wk of the KD, both the rates of body weight and fat loss were similar to baseline. (C) The calculated negative energy balance during the last 2 wk of the baseline period (BD −15 to 0 d) and the KD period (15–28 d) was not significantly different whether assessed by the measured body composition changes (DXA; n = 16) or by calculating energy intake minus expenditure as measured by DLW (n = 16). Horizontal solid lines indicate significant weight changes from the final BD day, P < 0.0012 as assessed by a paired, 2-sided t test and Bonferroni adjusted for 43 comparisons. *Significant change in fat mass from final BD day, P < 0.017 as assessed by a paired, 2-sided t test and Bonferroni adjusted for 3 comparisons. Means ± 95% CIs are presented. BD, high-carbohydrate baseline diet; DLW, doubly labeled water; DXA, dual-energy X-ray absorptiometry; KD, low-carbohydrate ketogenic diet.

