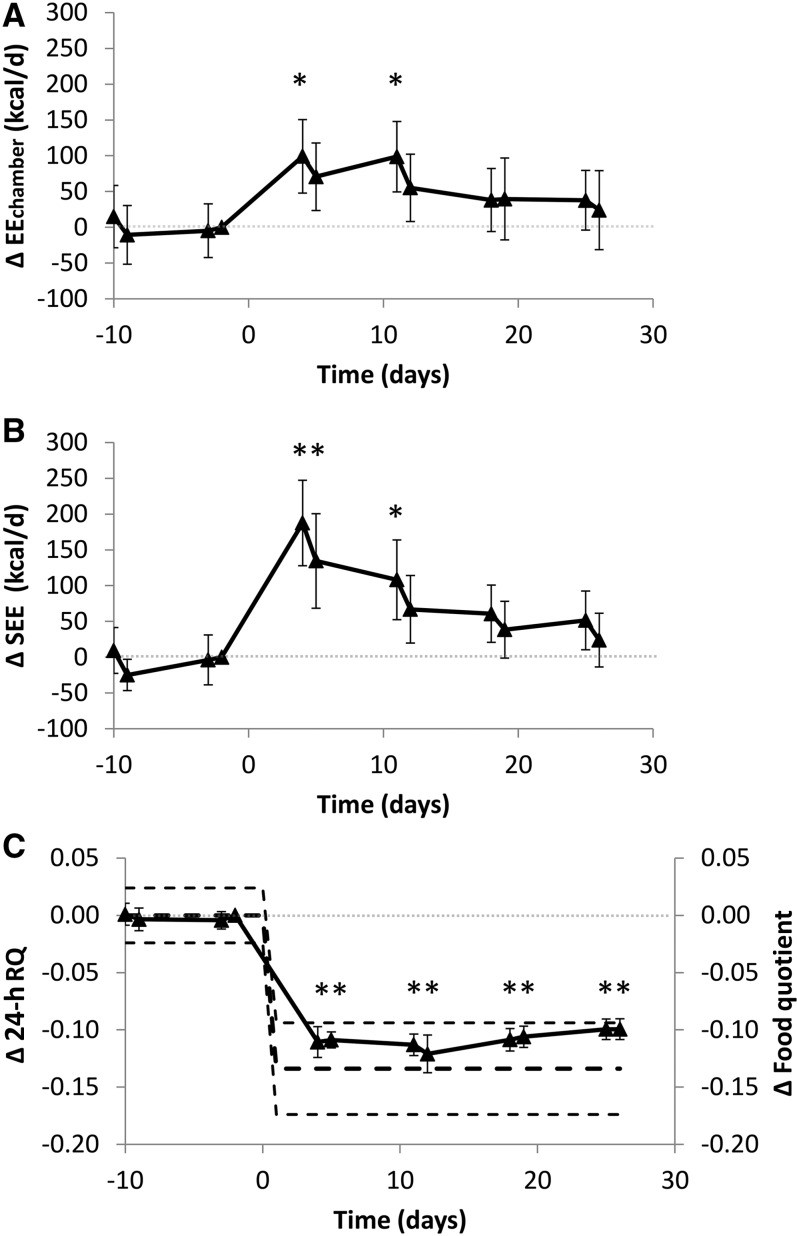
FIGURE 3.
Changes in total daily energy expenditure, SEE, and RQ. (A) EEchamber significantly increased within the first week of the KD compared with that of the final BD day, but subsequently there was a significant decreasing linear trend (P = 0.002). (B) SEE rapidly increased during the KD, but subsequently there was a significant decreasing linear trend (P < 0.0001). (C) Daily RQ (24-h RQ; n = 17) decreased within the first week of the KD and stayed significantly below that of BD throughout the remainder of the study and was close to the calculated mean change in food quotient (thick dashed black line) and within its 95% CI (thin dashed black lines). Means ± 95% CIs are presented, n = 17. *Significant change from the final BD day, P < 0.0045 as assessed by a paired, 2-sided t test and Bonferroni adjusted for 11 comparisons. Note that the statistical analyses presented in the main text and Table 2 used a repeated-measures mixed model rather than pairwise Bonferroni-adjusted comparisons with the final BD day. BD, high-carbohydrate baseline diet; EEchamber, total daily energy expenditure measured during repeated stays in metabolic chambers; KD, low-carbohydrate ketogenic diet; RQ, respiratory quotient; SEE, sleeping energy expenditure.

