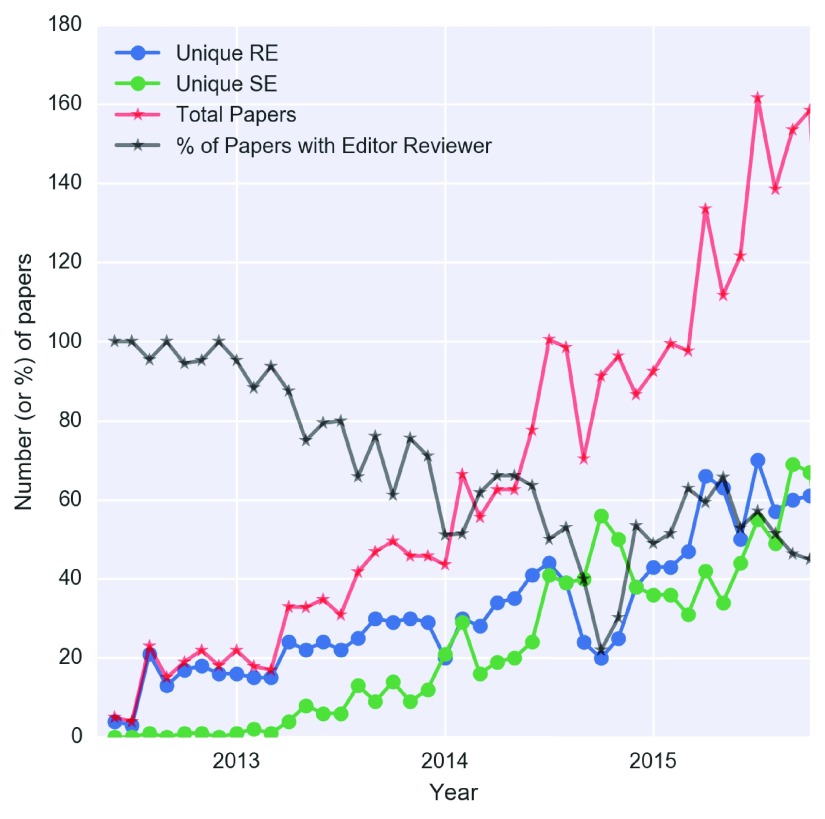
Figure 4. A decreasing proportion of Reviewing Editors served as one of the reviewers as submission volumes increased.
Time series plots for the number of active editors who served as one of the reviewers (Unique RE, blue) or not (Unique SE, green) in a given month. The total number of papers sent for peer review is shown in red. The % of papers is in black.

