
Fig. 3.
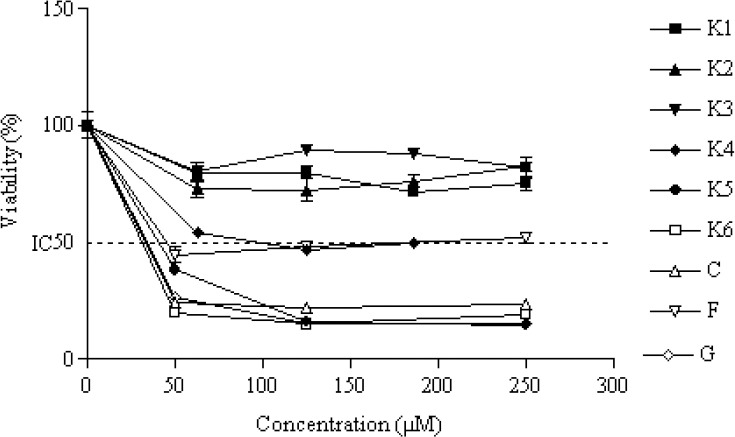
The percentage of cytotoxicity versus concentration by MTT exclusion on HT-29 cancer cell line. IC50 value was obtained by plotting the percentage of proliferation values versus drug concentrations. Data are expressed as the mean ± SEM of three separate experiments.