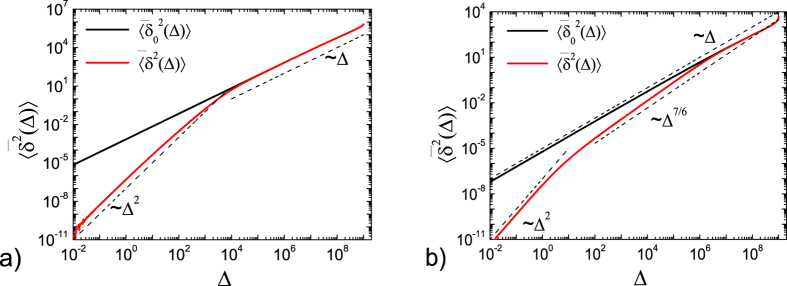
Figure 2. Time averaged MSD in the overdamped limit,  from numerical integration of Eq. (42) (black line) and in the full underdamped case,
  from Eqs (29), (42) and (43) (red line).
Here the trace length is t = 109 and we show the cases α = 1/2 (a) and α = 1/6 (b). Dashed lines show the asymptotics at short and long lag times. For α = 1/2 the transition between ballistic behaviour at short times,  , and the linear regime at long times,
  , is observed. For α = 1/6 an additional transient regime becomes obvious due to long ranging effects of the underdamped motion. The overdamped time averaged MSD is linear with respect to Δ in both cases,
  . The other parameters are the same as in Fig. 1. The shape of
  at Δ ≈ t is dominated by the pole in definition at which
  , see also below in Fig. 4.

