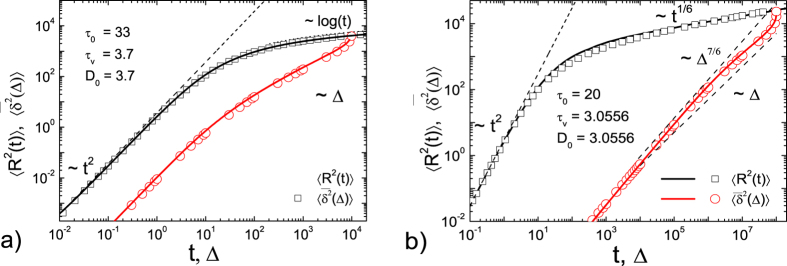
Figure 5.
MSD 〈x2(t)〉 and time averaged MSD  from event driven computer simulations of granular gases with constant restitution coefficient (a) and relative velocity dependent restitution coefficient with α = 1/6 (b). Symbols correspond to simulation results, the lines represent the analytical results of our UDSBM model, Eqs (28), (42) and (43) for panel (a), and Eqs (32), (61) and (62) for panel (b). Excellent agreement is observed.

