
Fig. 2.
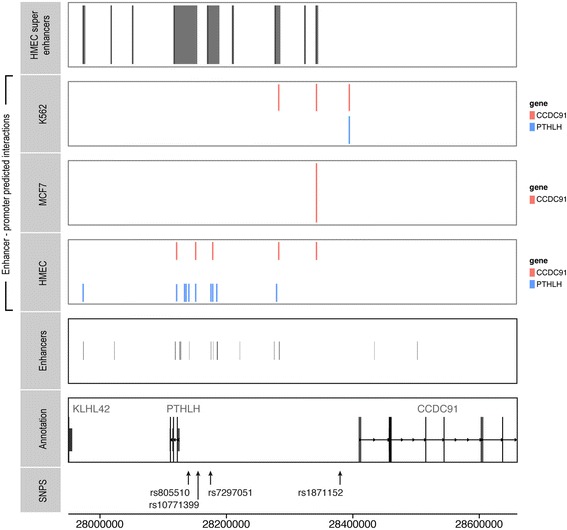
Enhancer-promoter interaction data at 12p11. From top to bottom, enhancer locations as defined by Corradin et al. [8] and Hnisz et al. [26] are shown in human mammary epithelial cells (HMEC) cell lines. Enhancer-promoter (EP)-predicted interactions as defined by He et al. [25] are shown in K562, MCF7 and HMEC cells. Gene annotations and single nucleotide polymorphism (SNP) annotations. Orange EP interactions are those with the coiled-coil domain containing 91 (CCDC91) gene; blue EP are those with Parathyroid hormone-like hormone (PTHLH)