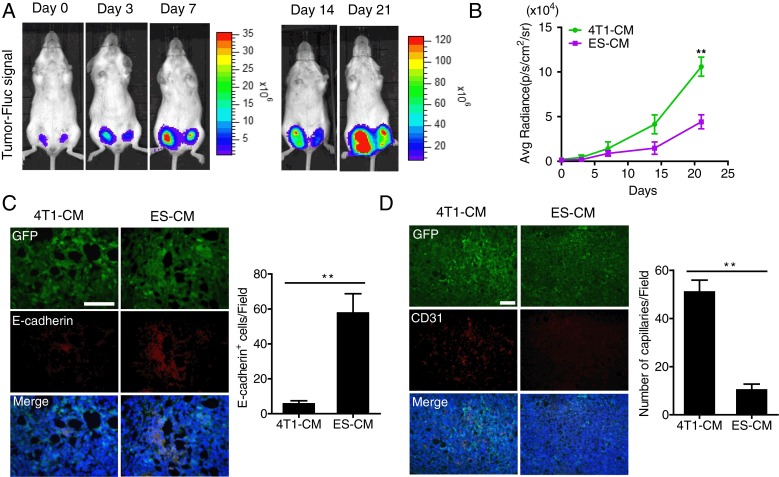
Fig. 5.
Inhibitory effect of ES-CM on tumor growth in vivo. a Firefly luciferase (Fluc) imaging of tumor progression. Representative animals injected with 2 × 10⁵ 4T1 (Fluc/GFP-pStat3/Rluc) cells after treatment with 4T1-CM and ES-CM for 48 h into the left and right of the fourth pair of mammary fat pads respectively. b Quantitative analysis of Fluc signal. **P < 0.01 vs 4T1-CM, n = 5. c, d Representative immunofluorescence staining of E-cadherin and CD31 of tumor tissue demonstrated a resistance of EMT progress and decreased tumor angiogenesis ability. Percentages of E-cadherin and CD31-positive cells are shown. Scale bar represents 100 μm. **P < 0.01 vs 4T1-CM, n = 3. See also Additional file 1: Figure S4. CM conditioned medium, ES embryonic stem, GFP green fluorescent protein

