Fig. 2.

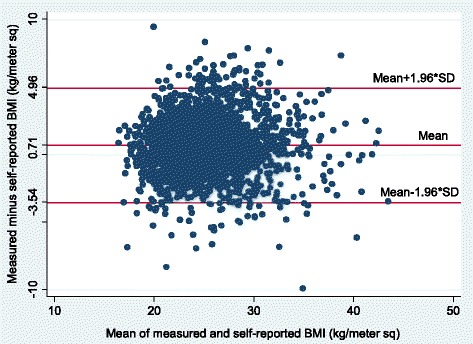
Bland-Altman plot for the difference in self-reported and measured BMI (with 95 % limits of agreement) against the mean of self-reported and measured BMI

Bland-Altman plot for the difference in self-reported and measured BMI (with 95 % limits of agreement) against the mean of self-reported and measured BMI