
Fig. 3.
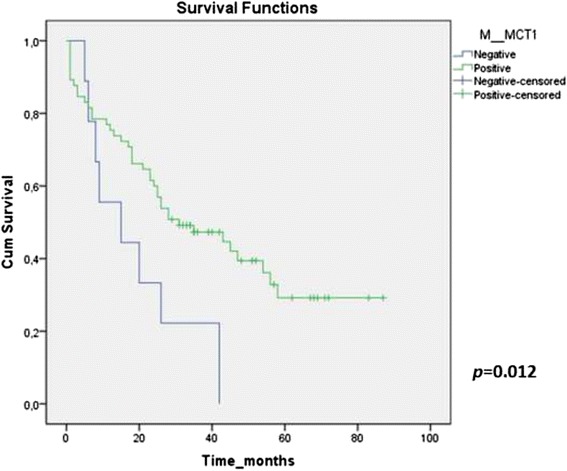
Kaplan-Meyer survival curve of MCT1 plasma membrane expression in CRC. stage IV. The illustration represents the survival curve related to MCT1 plasma membrane expression in CRC stage IV. Patients with negative expression of MCT1 show shorter survival (continuous line), whereas longer survival values were obtained for patients with MCT1 positive expression (interrupted line) (p = 0.012)