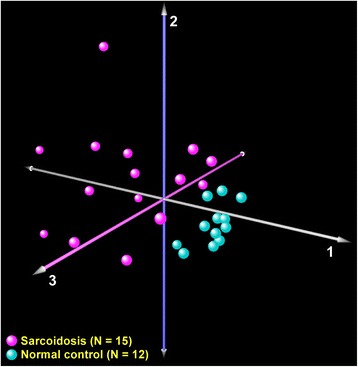
Fig. 1.

Correspondence analysis of transcriptional profiles between sarcoidosis patients (magenta) and normal controls (cyan). Each axis captures a proportion of the observed whole-genome expression variability across all subjects. Note that this unbiased analysis segregated the cohort into two groups based on disease status, implying that sarcoidosis induces global changes in BAL cell transcriptome
