
Fig. 2.
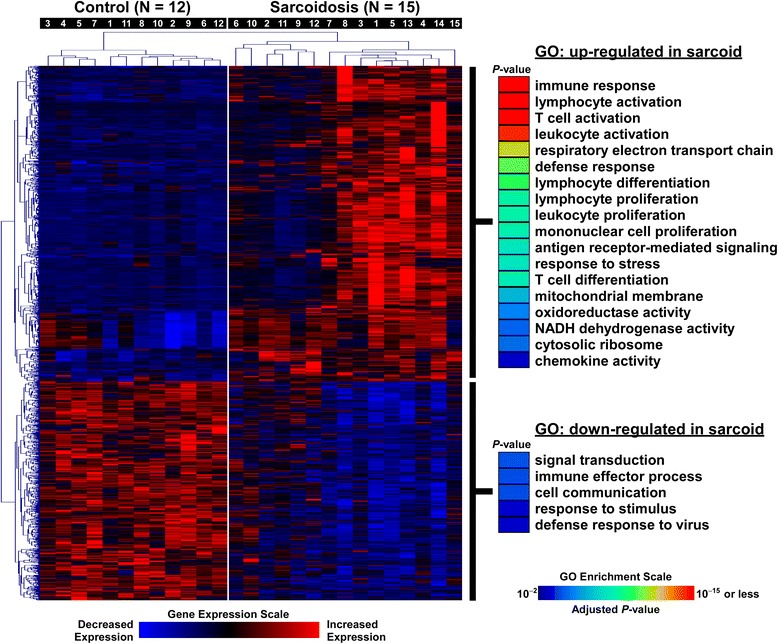
Cluster analysis of differentially expressed genes in BAL cells between sarcoidosis patients and normal controls. Subject numbers correspond to Table 1 descriptions. Significantly over-represented processes among differentially upregulated and downregulated genes in sarcoidosis were identified using Gene Ontology (GO) annotation and are shown on the right panel