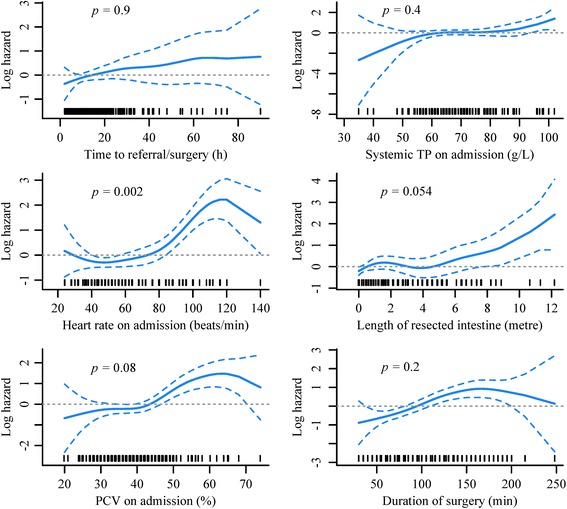
Fig. 4.

Plots of P-spline smoothers of continuous pre- and intraoperative variables. Penalised regression models were used to investigate the functional form of the relationships between the log hazard of postoperative death and continuous variables measured pre and intraoperatively. The plots show the fitted curves with 95 % confidence intervals (dashed lines) and the rug plots along the x-axes represent the number of data points. Dotted horizontal lines are at log hazard of zero. The p values are from chi square tests for non-linearity where a significant p value (p >0.05) indicates a non-linear association
