
Fig. 2.
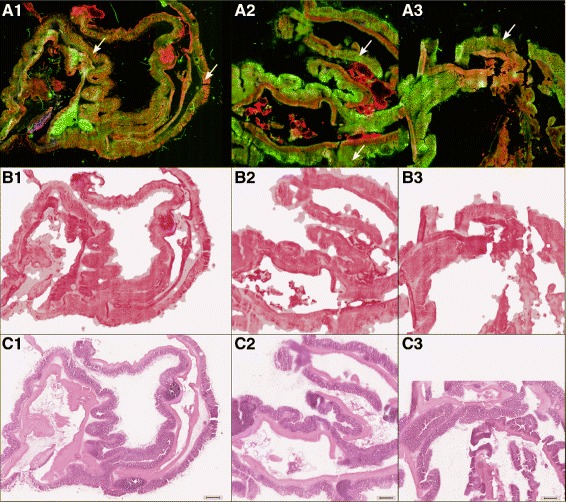
Overview of acquired and generated images of mouse colon sections (3 out of 22 images in total): In row A, multimodal images are displayed (for details see Methods Section, non-linear multimodal microscopy). In row B and C the computationally derived pseudo-HE stained images based on the multimodal images and the HE stained image are displayed, respectively. The pseudo-HE images of row B are generated non-invasively allowing for a subsequent analysis by other modalities or stains. Red flag regions, which were subsequently analyzed by Raman-spectroscopy (see Fig. 4) are marked with a white arrow in row A. The scale bar represents 500 μm