
Fig. 3.
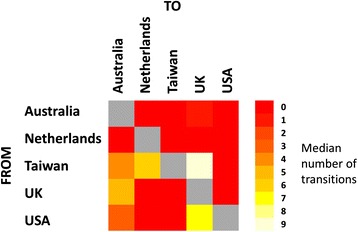
Inferred number of transitions between locations. The median number of transitions from one location to another under the Markov jumps analysis was calculated across the BEAST phylogeny samples. Lighter blocks in the heat map indicate a higher number of transitions. The highest numbers of transitions were from Taiwan to Australia and the UK and from the USA to the UK