Fig. 2.

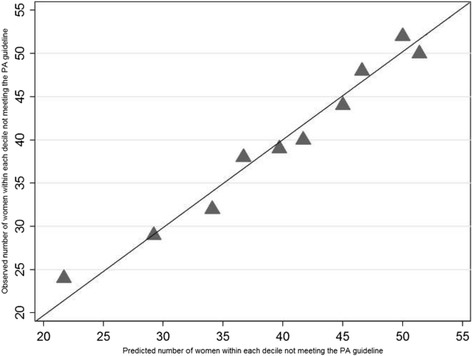
Calibration plot. Triangles (▲) express the agreement between observed and predicted non-compliance with the physical activity guideline for each sample decile. The 45° line represents perfect predictions

Calibration plot. Triangles (▲) express the agreement between observed and predicted non-compliance with the physical activity guideline for each sample decile. The 45° line represents perfect predictions