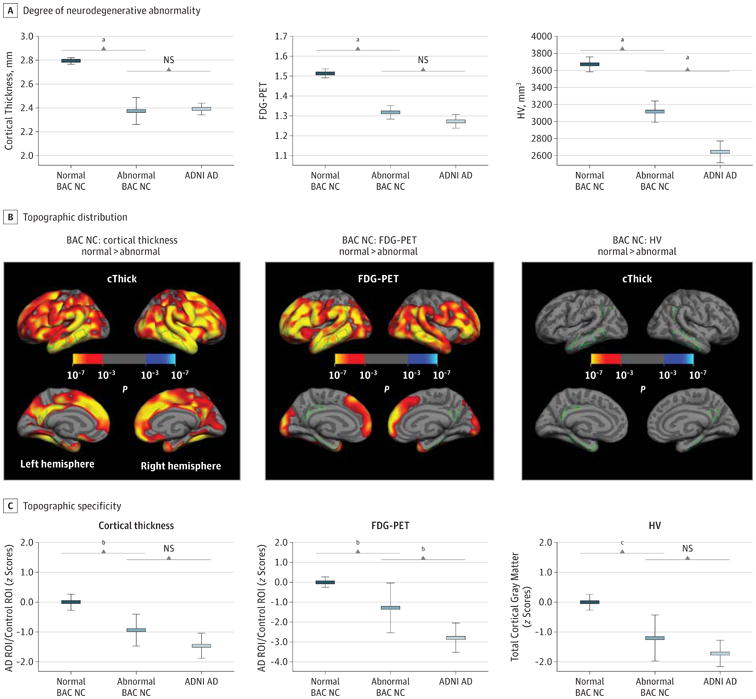
Figure 2. Degree and Topographic Distribution of Neurodegenerative Abnormalities in the Berkley Aging Cohort (BAC) Cognitively Normal (NC) Cases.

A and C, For cortical thickness, fludeoxyglucose positron emission tomography (FDG-PET), and hippocampal volume (HV), degree of neurodegenerative abnormality within the Alzheimer disease (AD) region of interest (ROI) (A) and topographic specificity (C) are depicted for biomarker normal and abnormal BAC NC cases and Alzheimer's Disease Neuroimaging Initiative (ADNI) AD cases. B, Cortexwide comparisons between normal and abnormal BAC NC cases. cThick indicates cortical thickness and NS, not significant.
aP < .001.
bP < .05.
cP < .01.
